Concept / self-initiated

CloudScope · Independent SaaS concept

Making cloud costs and operations easier to understand.

An exploration of how a cloud operations workspace can bring spending visibility, resource context and operational signals into one coherent experience.

Product designSaaS dashboardCloud operationsIndependent concept · illustrative data
Role
Solo product designer
Year
2026
Platform
Web dashboard
Status
Independent concept · illustrative data
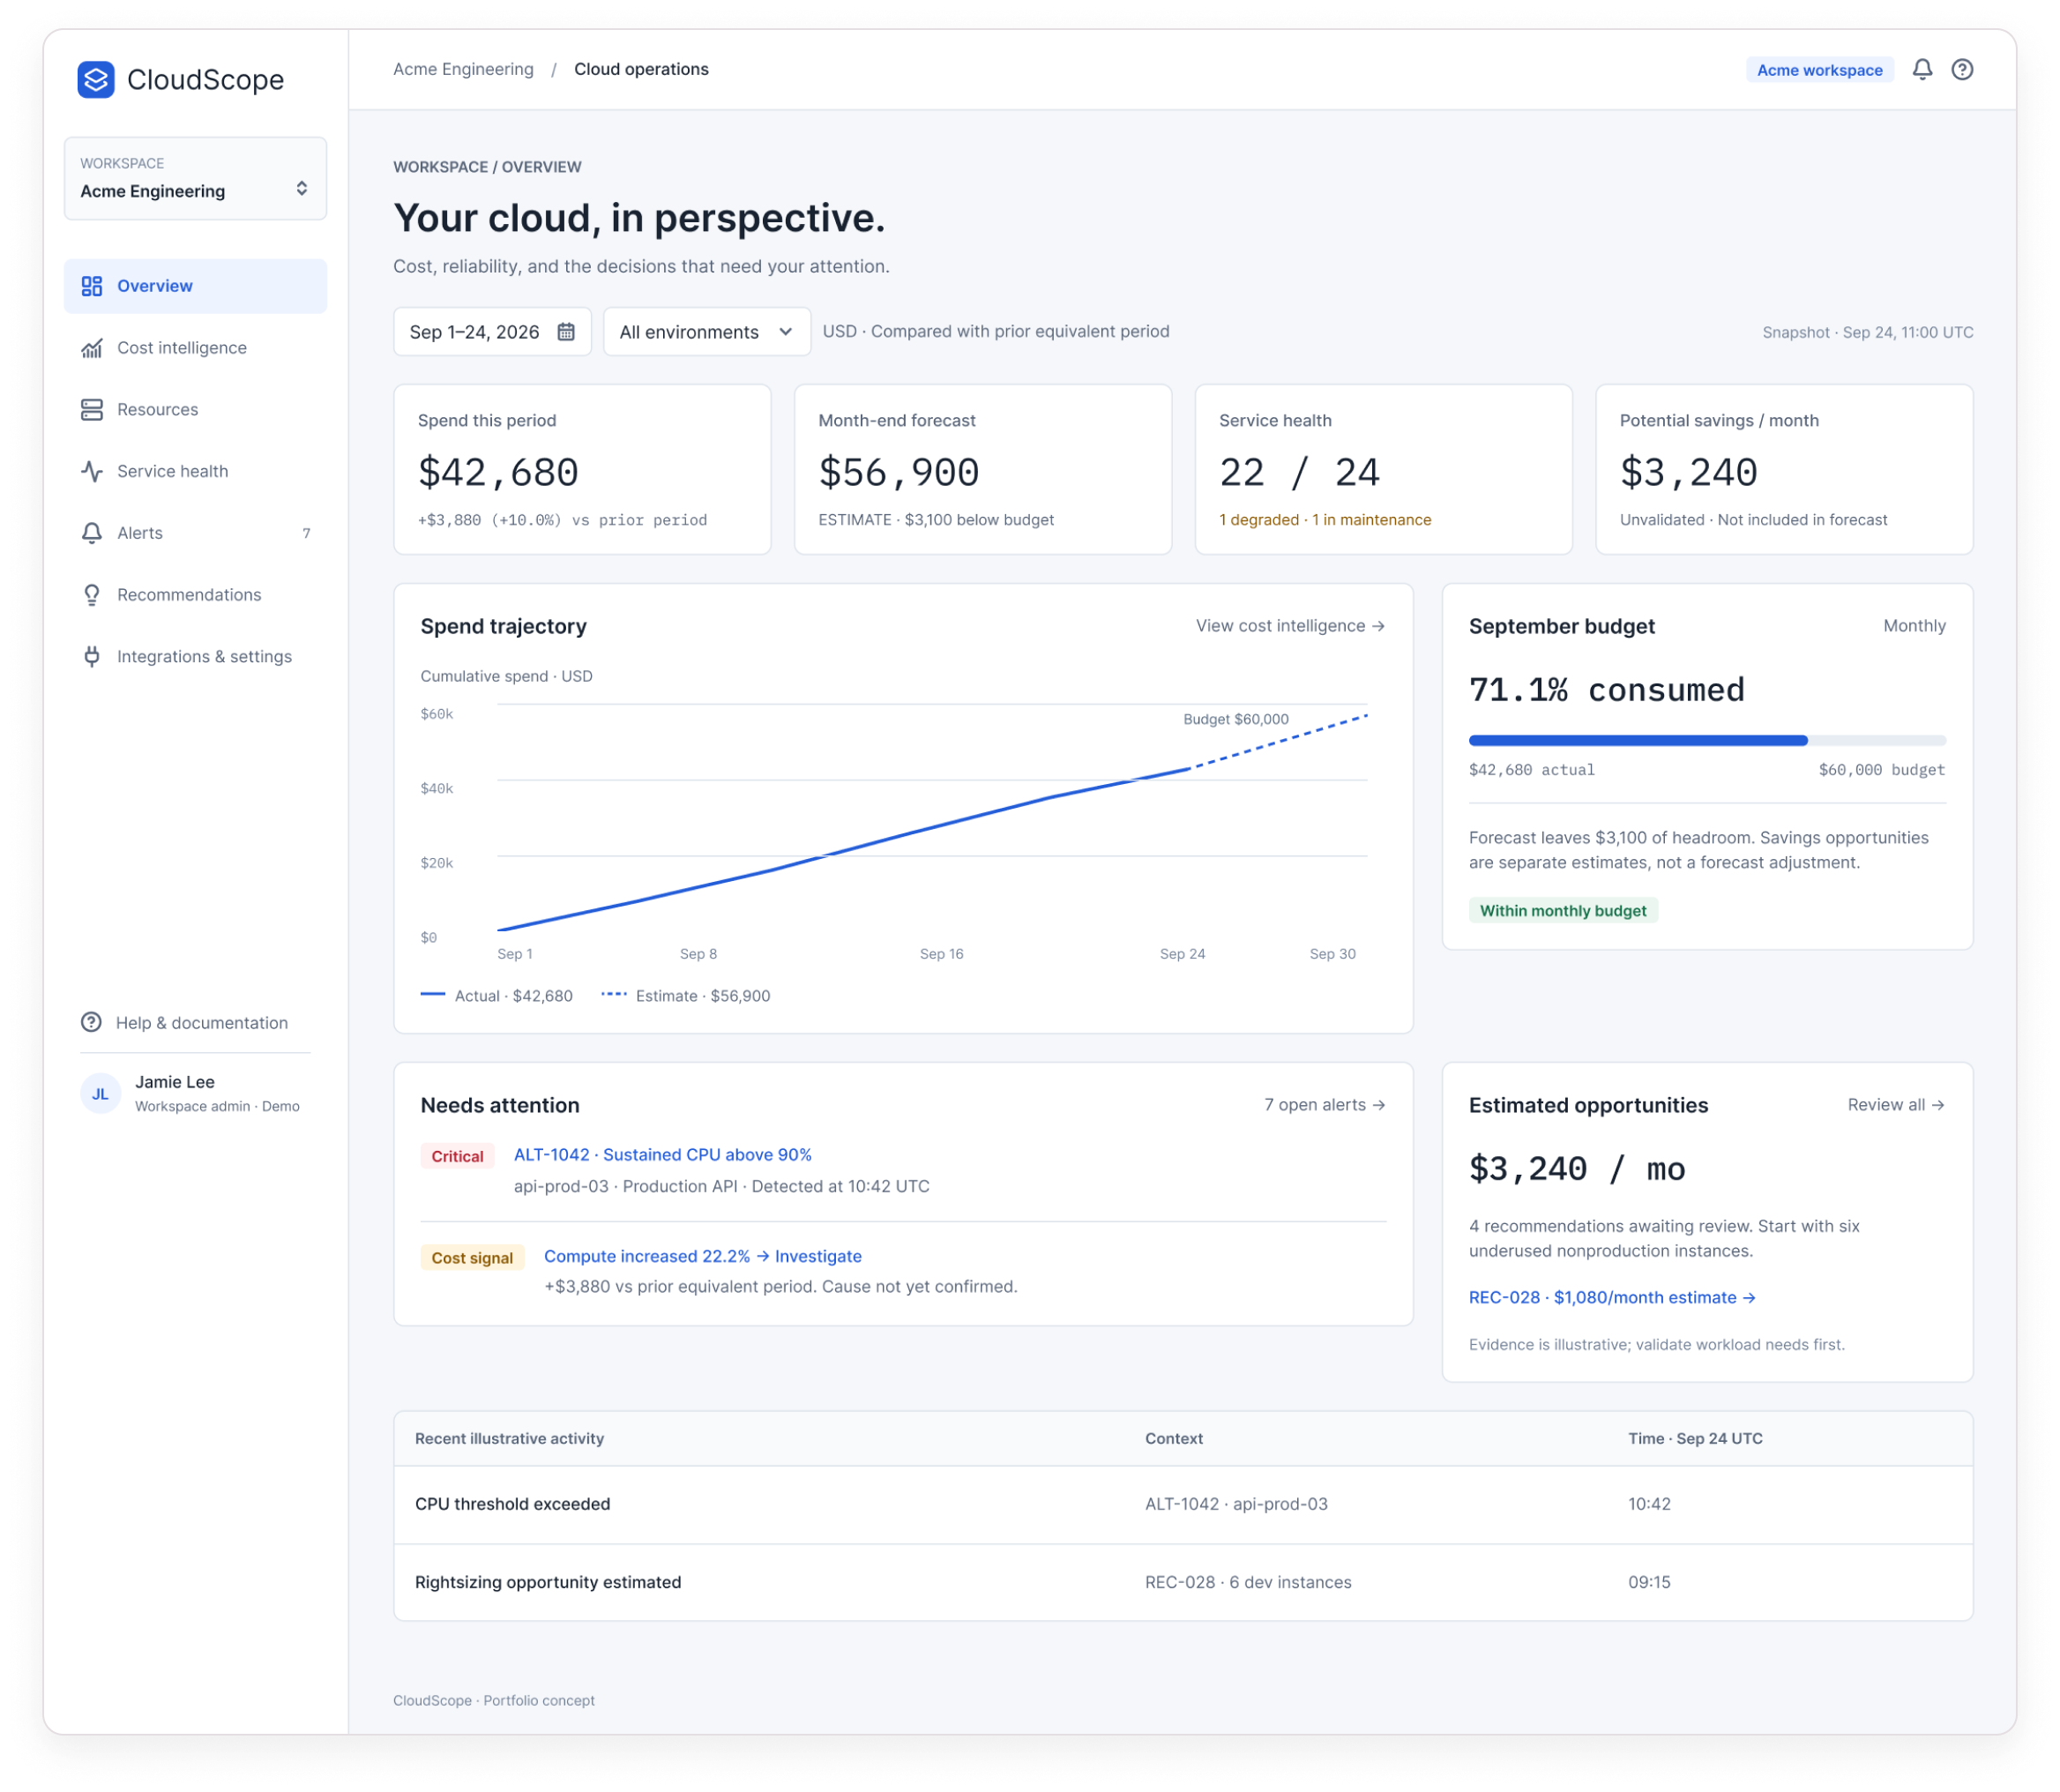
CloudScope overview dashboard for the fictional Acme Engineering workspace

Project snapshot

Project
CloudScope
Type
Independent SaaS product concept
Product area
Cloud operations and cost intelligence
Platform
Web dashboard · desktop, light mode
Intended audience
Cloud administrators, engineers, engineering leads and cost-conscious teams
Focus areas
Information architecture, data visualisation, operational visibility, investigation flows and interface states
Scope in the file
13 dashboard screens, 5 user-flow maps, a states board, foundations and a first-pass component library
Data
Fictional “Acme Engineering” demo workspace , every figure is illustrative
Role
Solo product designer
Year
2026

The problem space

The numbers exist. The story between them doesn’t.

Spend, budgets, resources and alerts tend to sit in separate views, each correct on its own. Working out whether a spending change matters , and where to look next , means stitching those views together by hand.

This is the problem the concept explores. It isn’t based on formal user research.

Design challenge

How might we help cloud teams turn complex cost and operational information into a clear, actionable understanding of their cloud environment?

01

Visibility

A clear overview of spending, budgets, resources and alerts , in one place.

02

Investigation

A path from a high-level signal into the breakdowns and context that explain it.

03

Decision support

Possible next steps, without mistaking an estimate or recommendation for a confirmed outcome.

Product approach

Signal → context → decision.

One shared workspace for engineering and FinOps, rather than separate tools for each. Every screen starts broad and lets you go one level deeper , and each level is honest about what it knows.

OverviewSee the signal
Cost intelligenceWhere is spend changing?
Compute investigationEvidence vs hypothesis
Resource & alertOperational context
RecommendationReview a possible next step
Follow-upRecorded · nothing executed

Start with an overview

Spend, forecast, health and savings in one glance , with the decisions that need attention.

Go one level deeper

Every summary links to the breakdown that explains it.

Keep evidence and hypothesis apart

A cost increase is evidence. Autoscaling is a hypothesis until it’s checked.

Label every estimate

Forecasts and savings are dashed, tagged and never quietly added to actual spend.

Keep humans in control

Acknowledging isn’t resolving. Marking for follow-up records a plan; it never changes infrastructure.

Plan for missing data

Loading, error, disconnected and permission states say what’s unavailable and what to do next.

The key experience

Investigating a cost change.

Spend is up 10% this period. Here’s how the proposed workflow takes a team from that signal to a reviewed , but not executed , next step. All data is illustrative.

Step 01

See the bigger picture

The question
Is anything this month worth my attention?
What’s visible
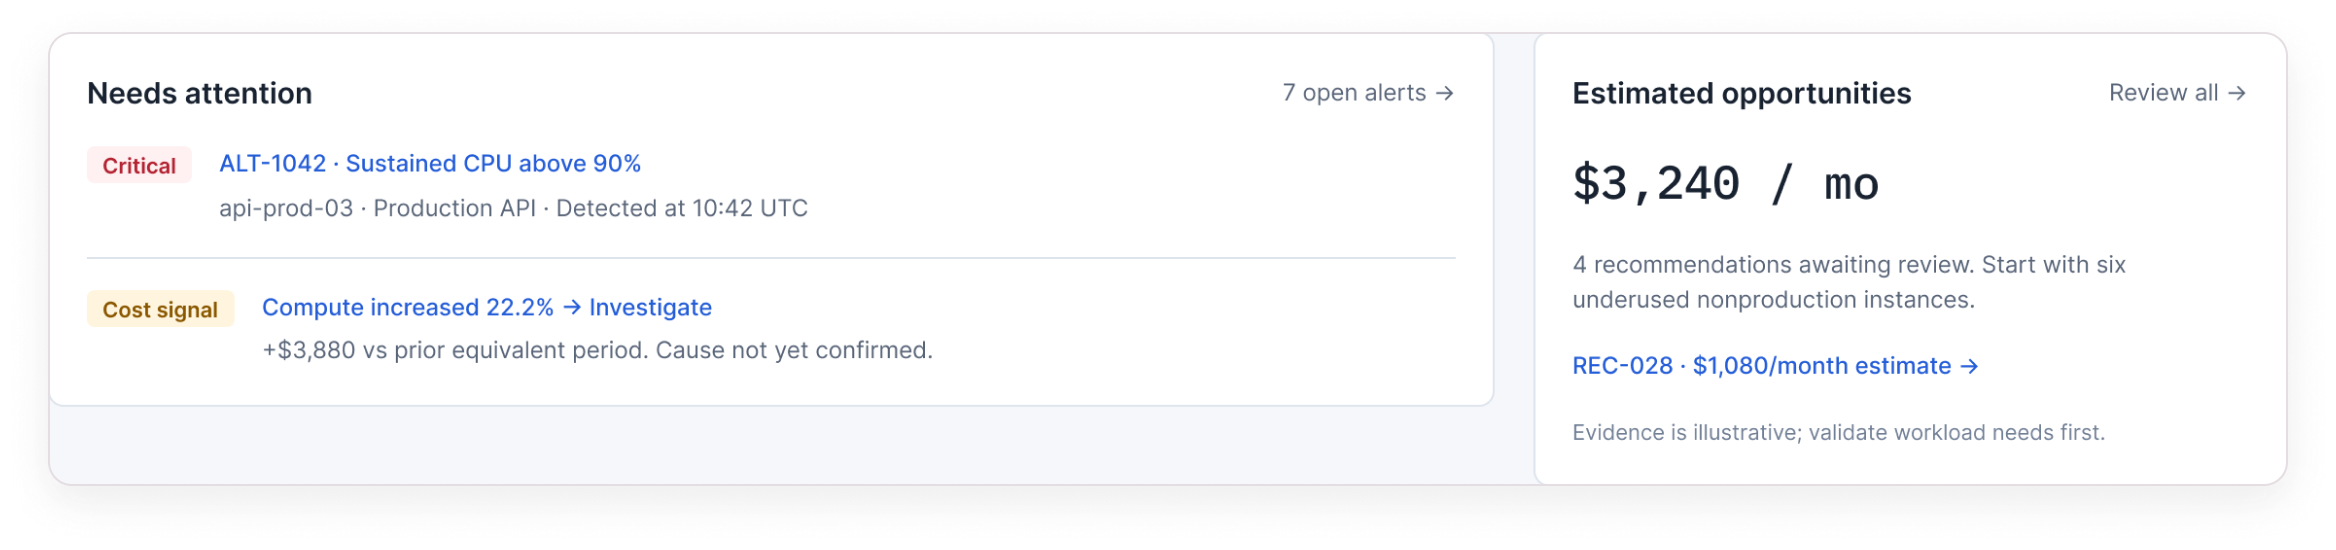
Spend this period ($42,680, +10%), a month-end forecast tagged ESTIMATE, service health (22 of 24), and $3,240 of potential savings marked “unvalidated”. A “Needs attention” panel surfaces the critical alert and a cost signal: compute up 22.2%.
Design decision
Measured values, estimates and unvalidated savings each carry their own label , and savings are never subtracted from the forecast.
Leads to
“View cost intelligence →” and “Compute increased 22.2% → Investigate”.

Detail: four metric cards , spend, forecast (estimate), service health and potential savings (unvalidated)
Detail: Needs attention panel with alert ALT-1042 and the compute cost signal

Step 02

Understand where spending is changing

The question
Where is the extra spend coming from?
What’s visible
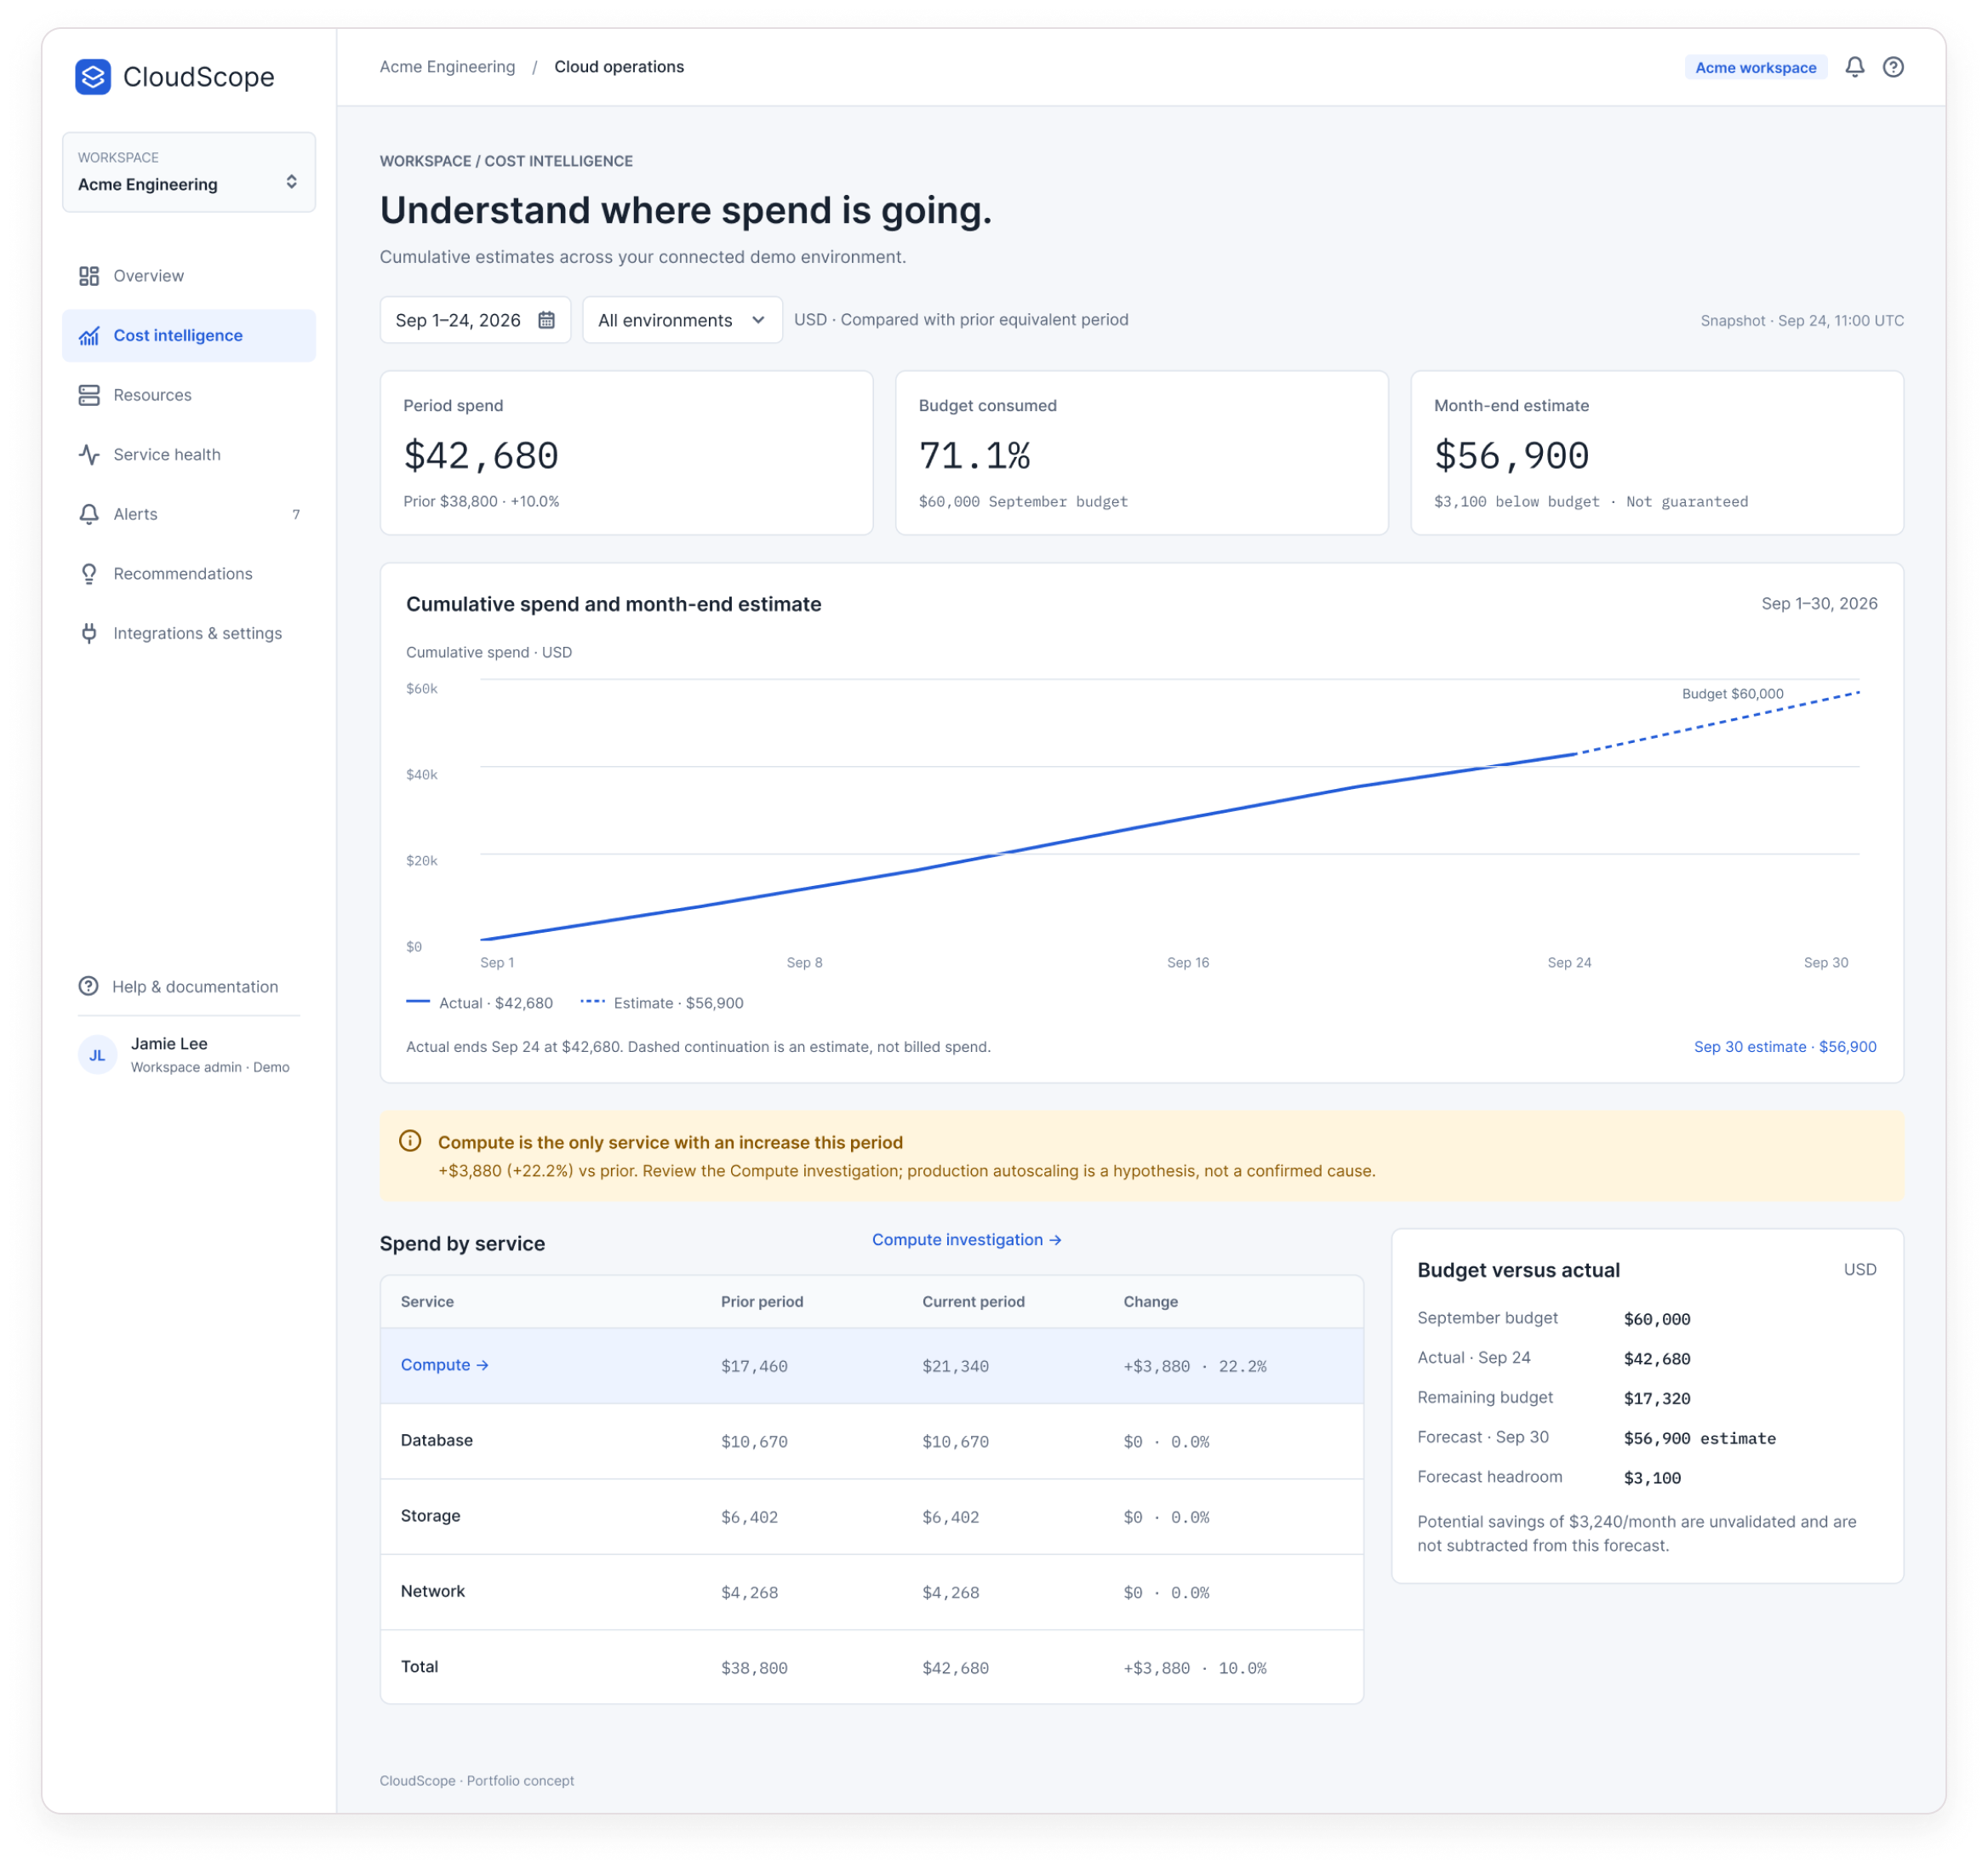
A cumulative spend chart against a $60,000 budget, a spend-by-service table, and a banner: compute is the only service with an increase.
Design decision
Actual spend stops at today; the continuation is dashed and captioned “an estimate, not billed spend”.
Leads to
“Compute investigation →”.
CloudScope cost intelligence screen

Step 03

Separate what changed from why it might have

The question
Compute is up $3,880 , do we know why?
What’s visible
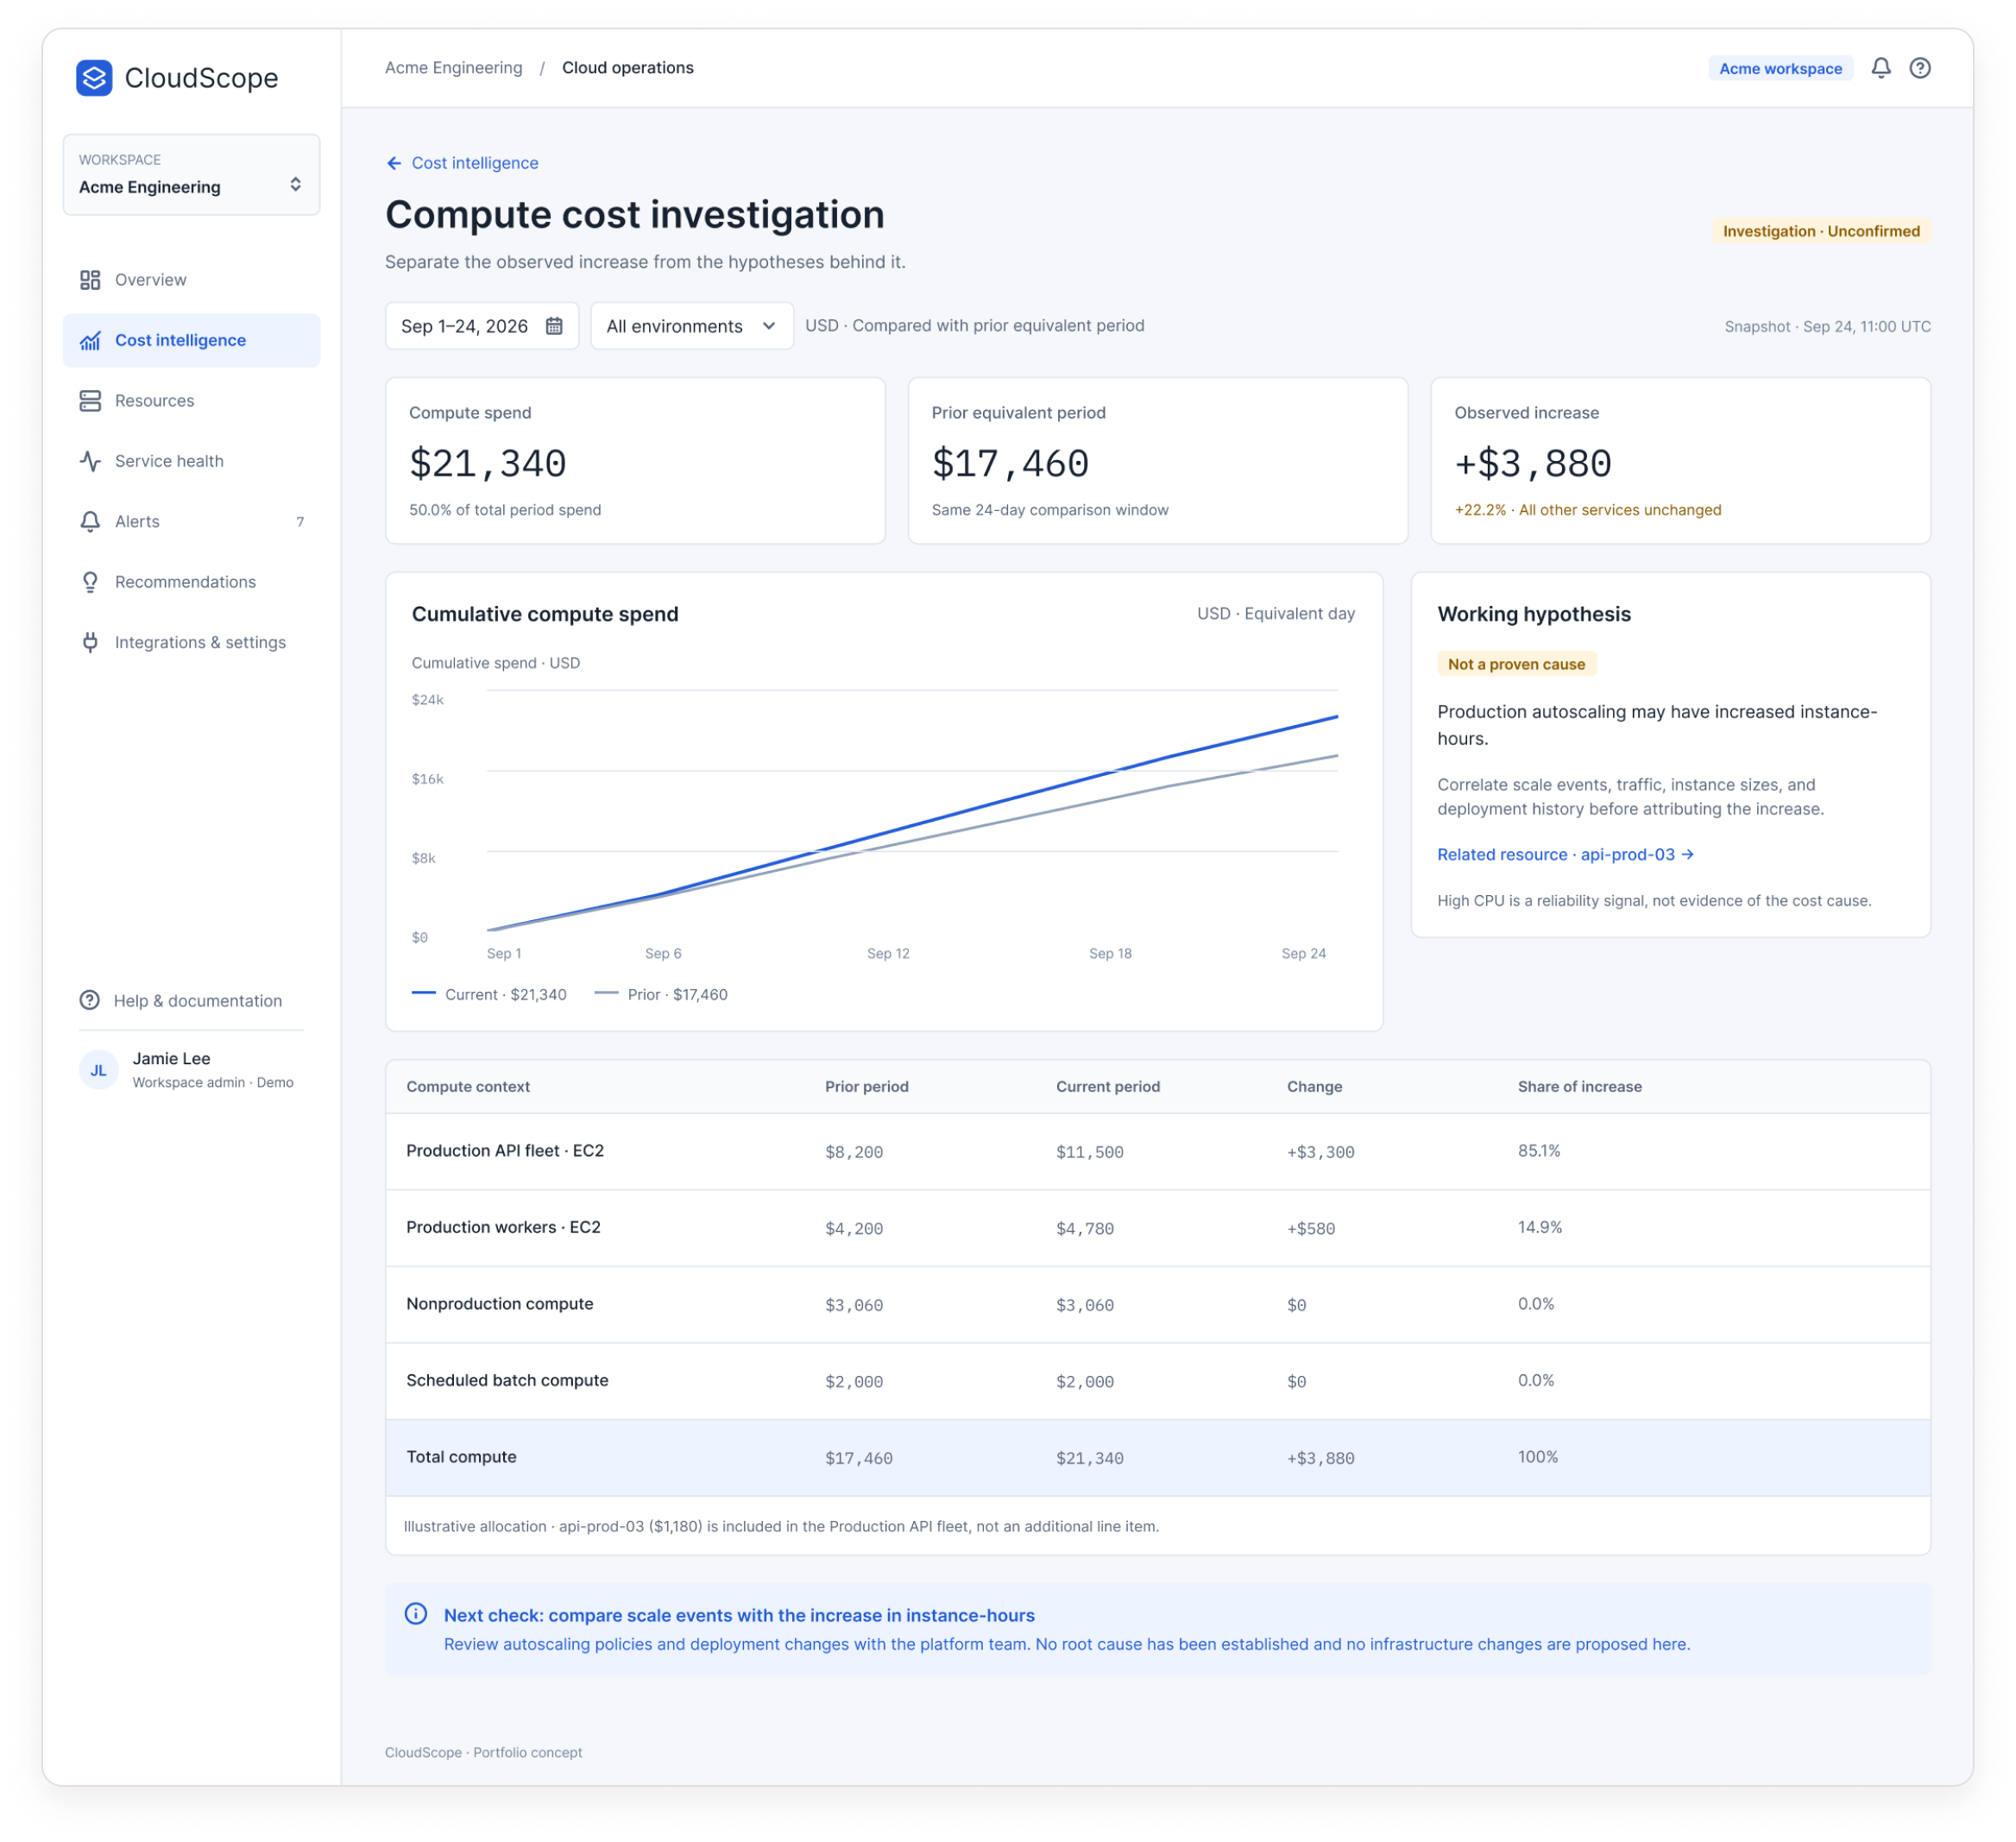
Current vs prior compute spend on equivalent days, a “Working hypothesis · Not a proven cause” card about autoscaling, and a table showing the Production API fleet accounts for 85.1% of the increase.
Design decision
The page is labelled “Investigation · Unconfirmed”. It names the next check , compare scale events with instance-hours , and states that no root cause has been established.
Leads to
“Related resource · api-prod-03 →”.
CloudScope compute cost investigation screen

Step 04

Investigate the resource and the alert behind it

The question
Is this resource part of the story, and how urgent is it?
What’s visible
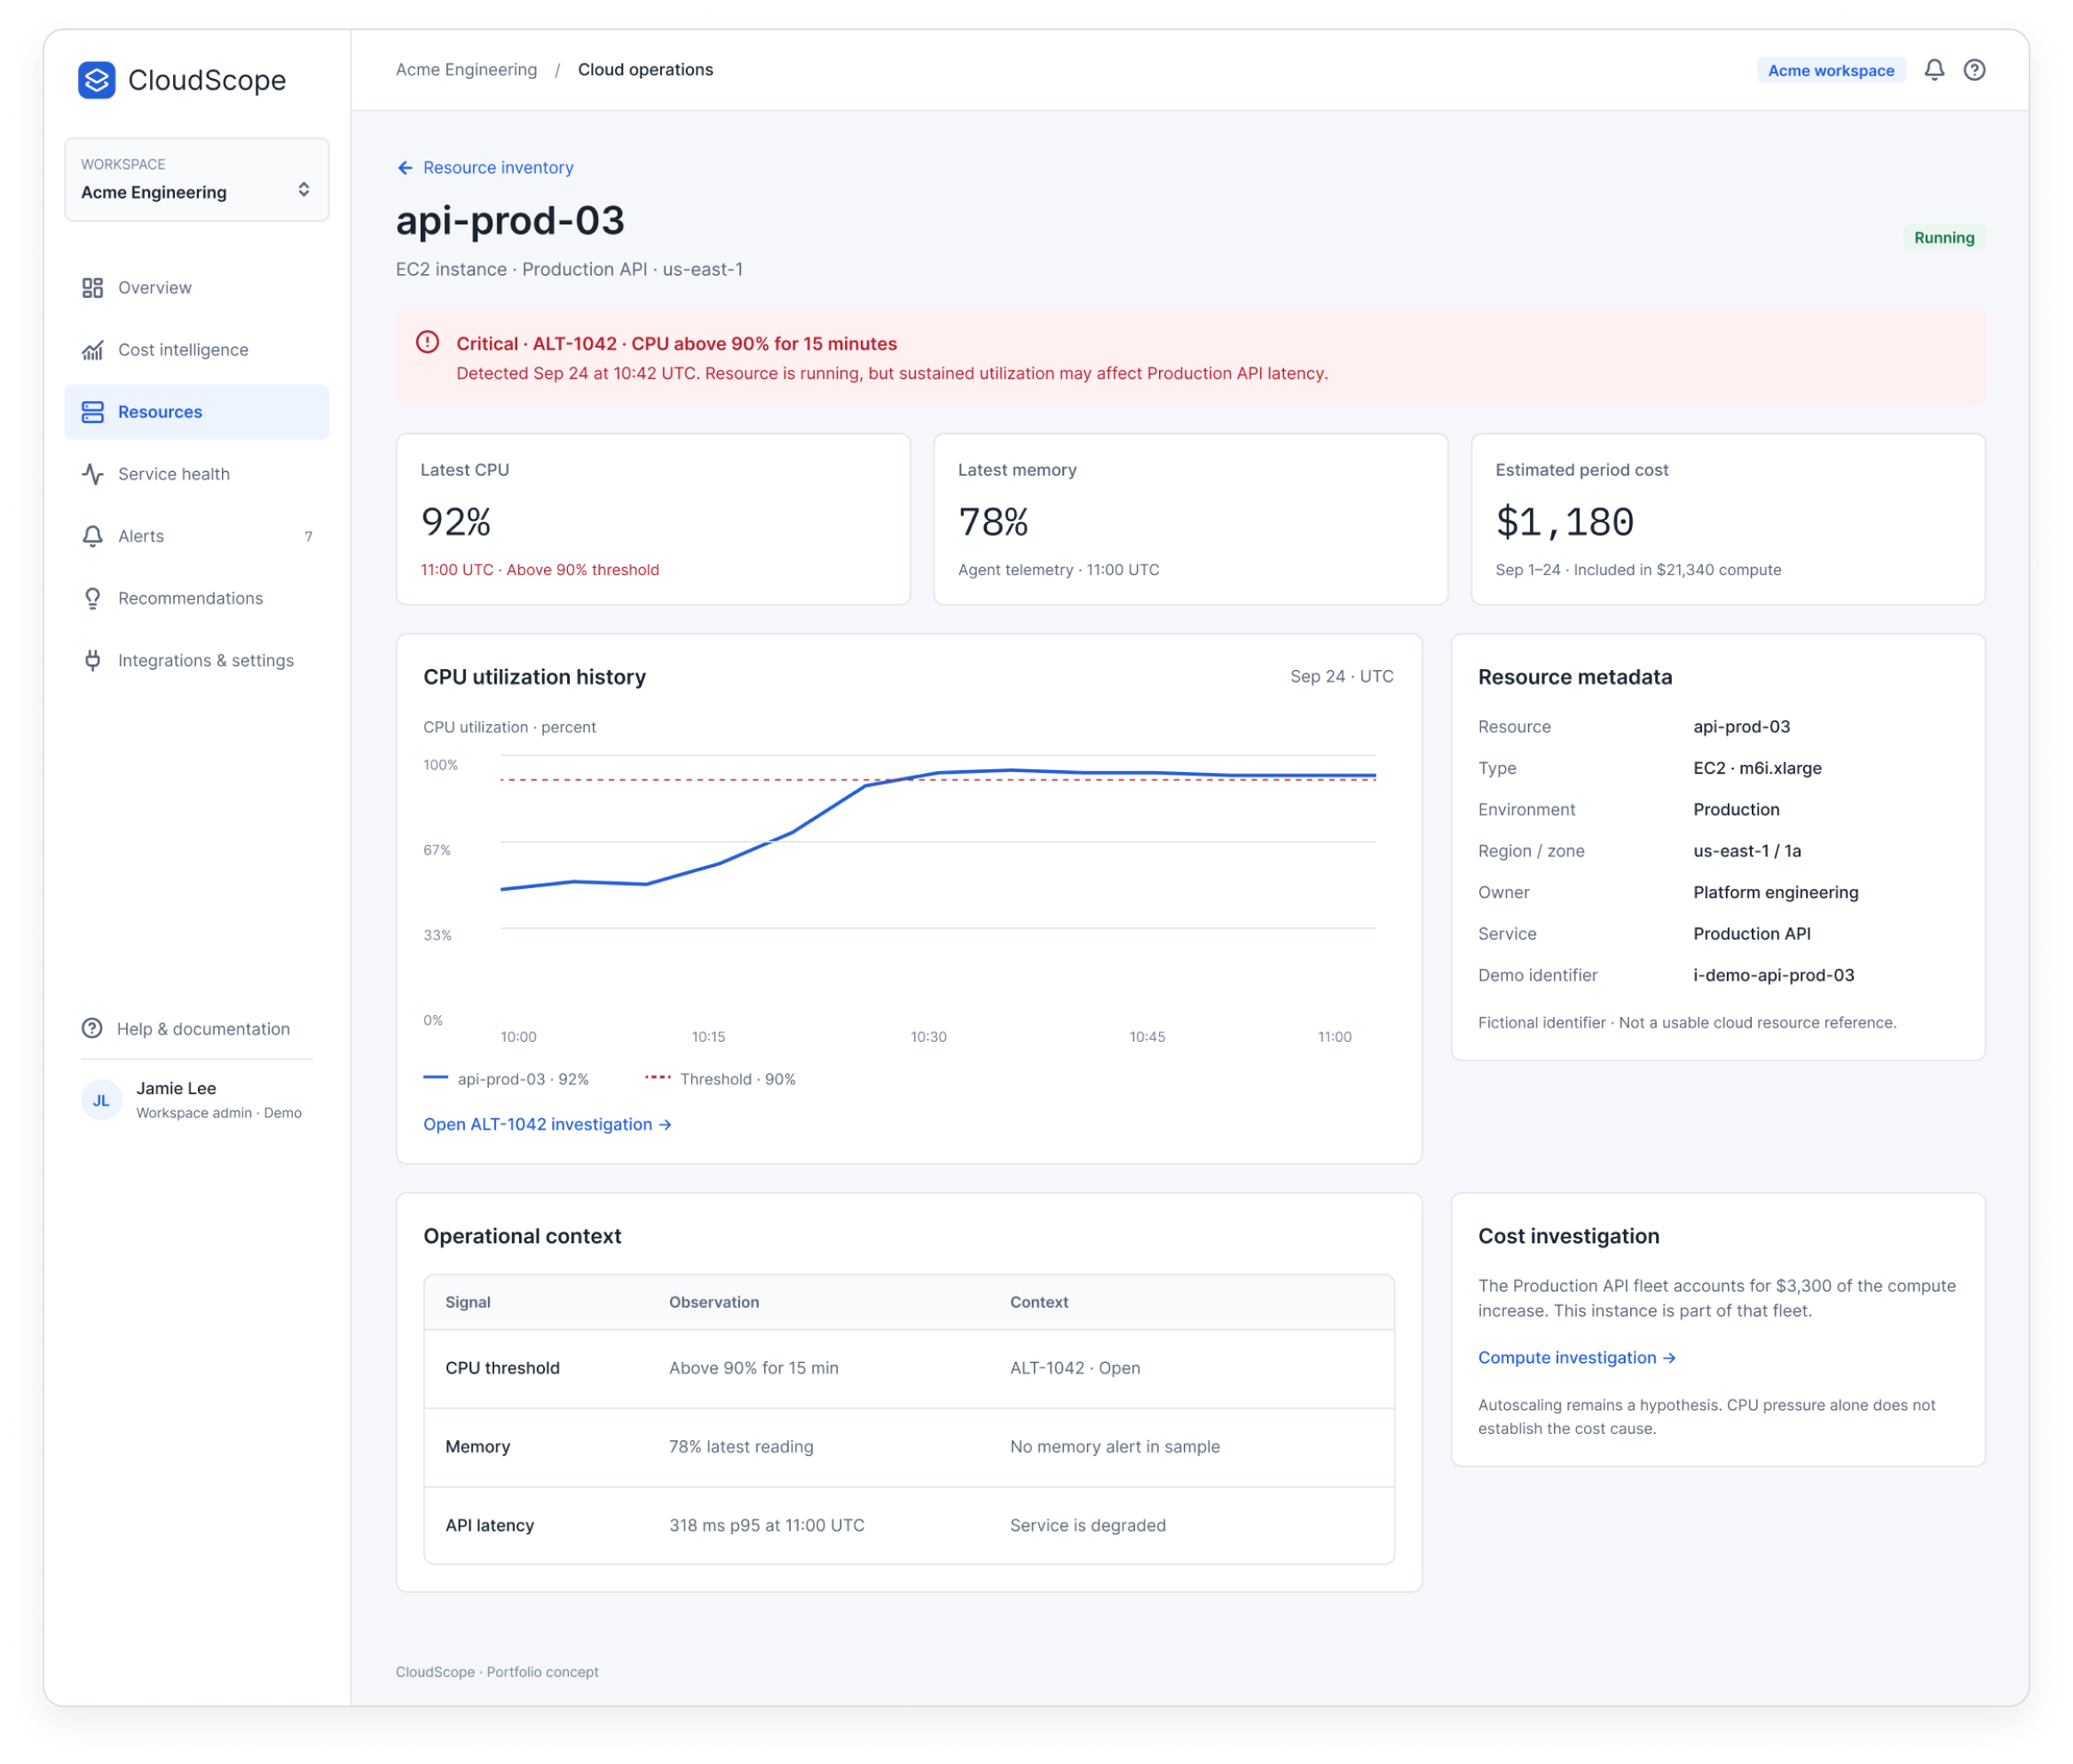
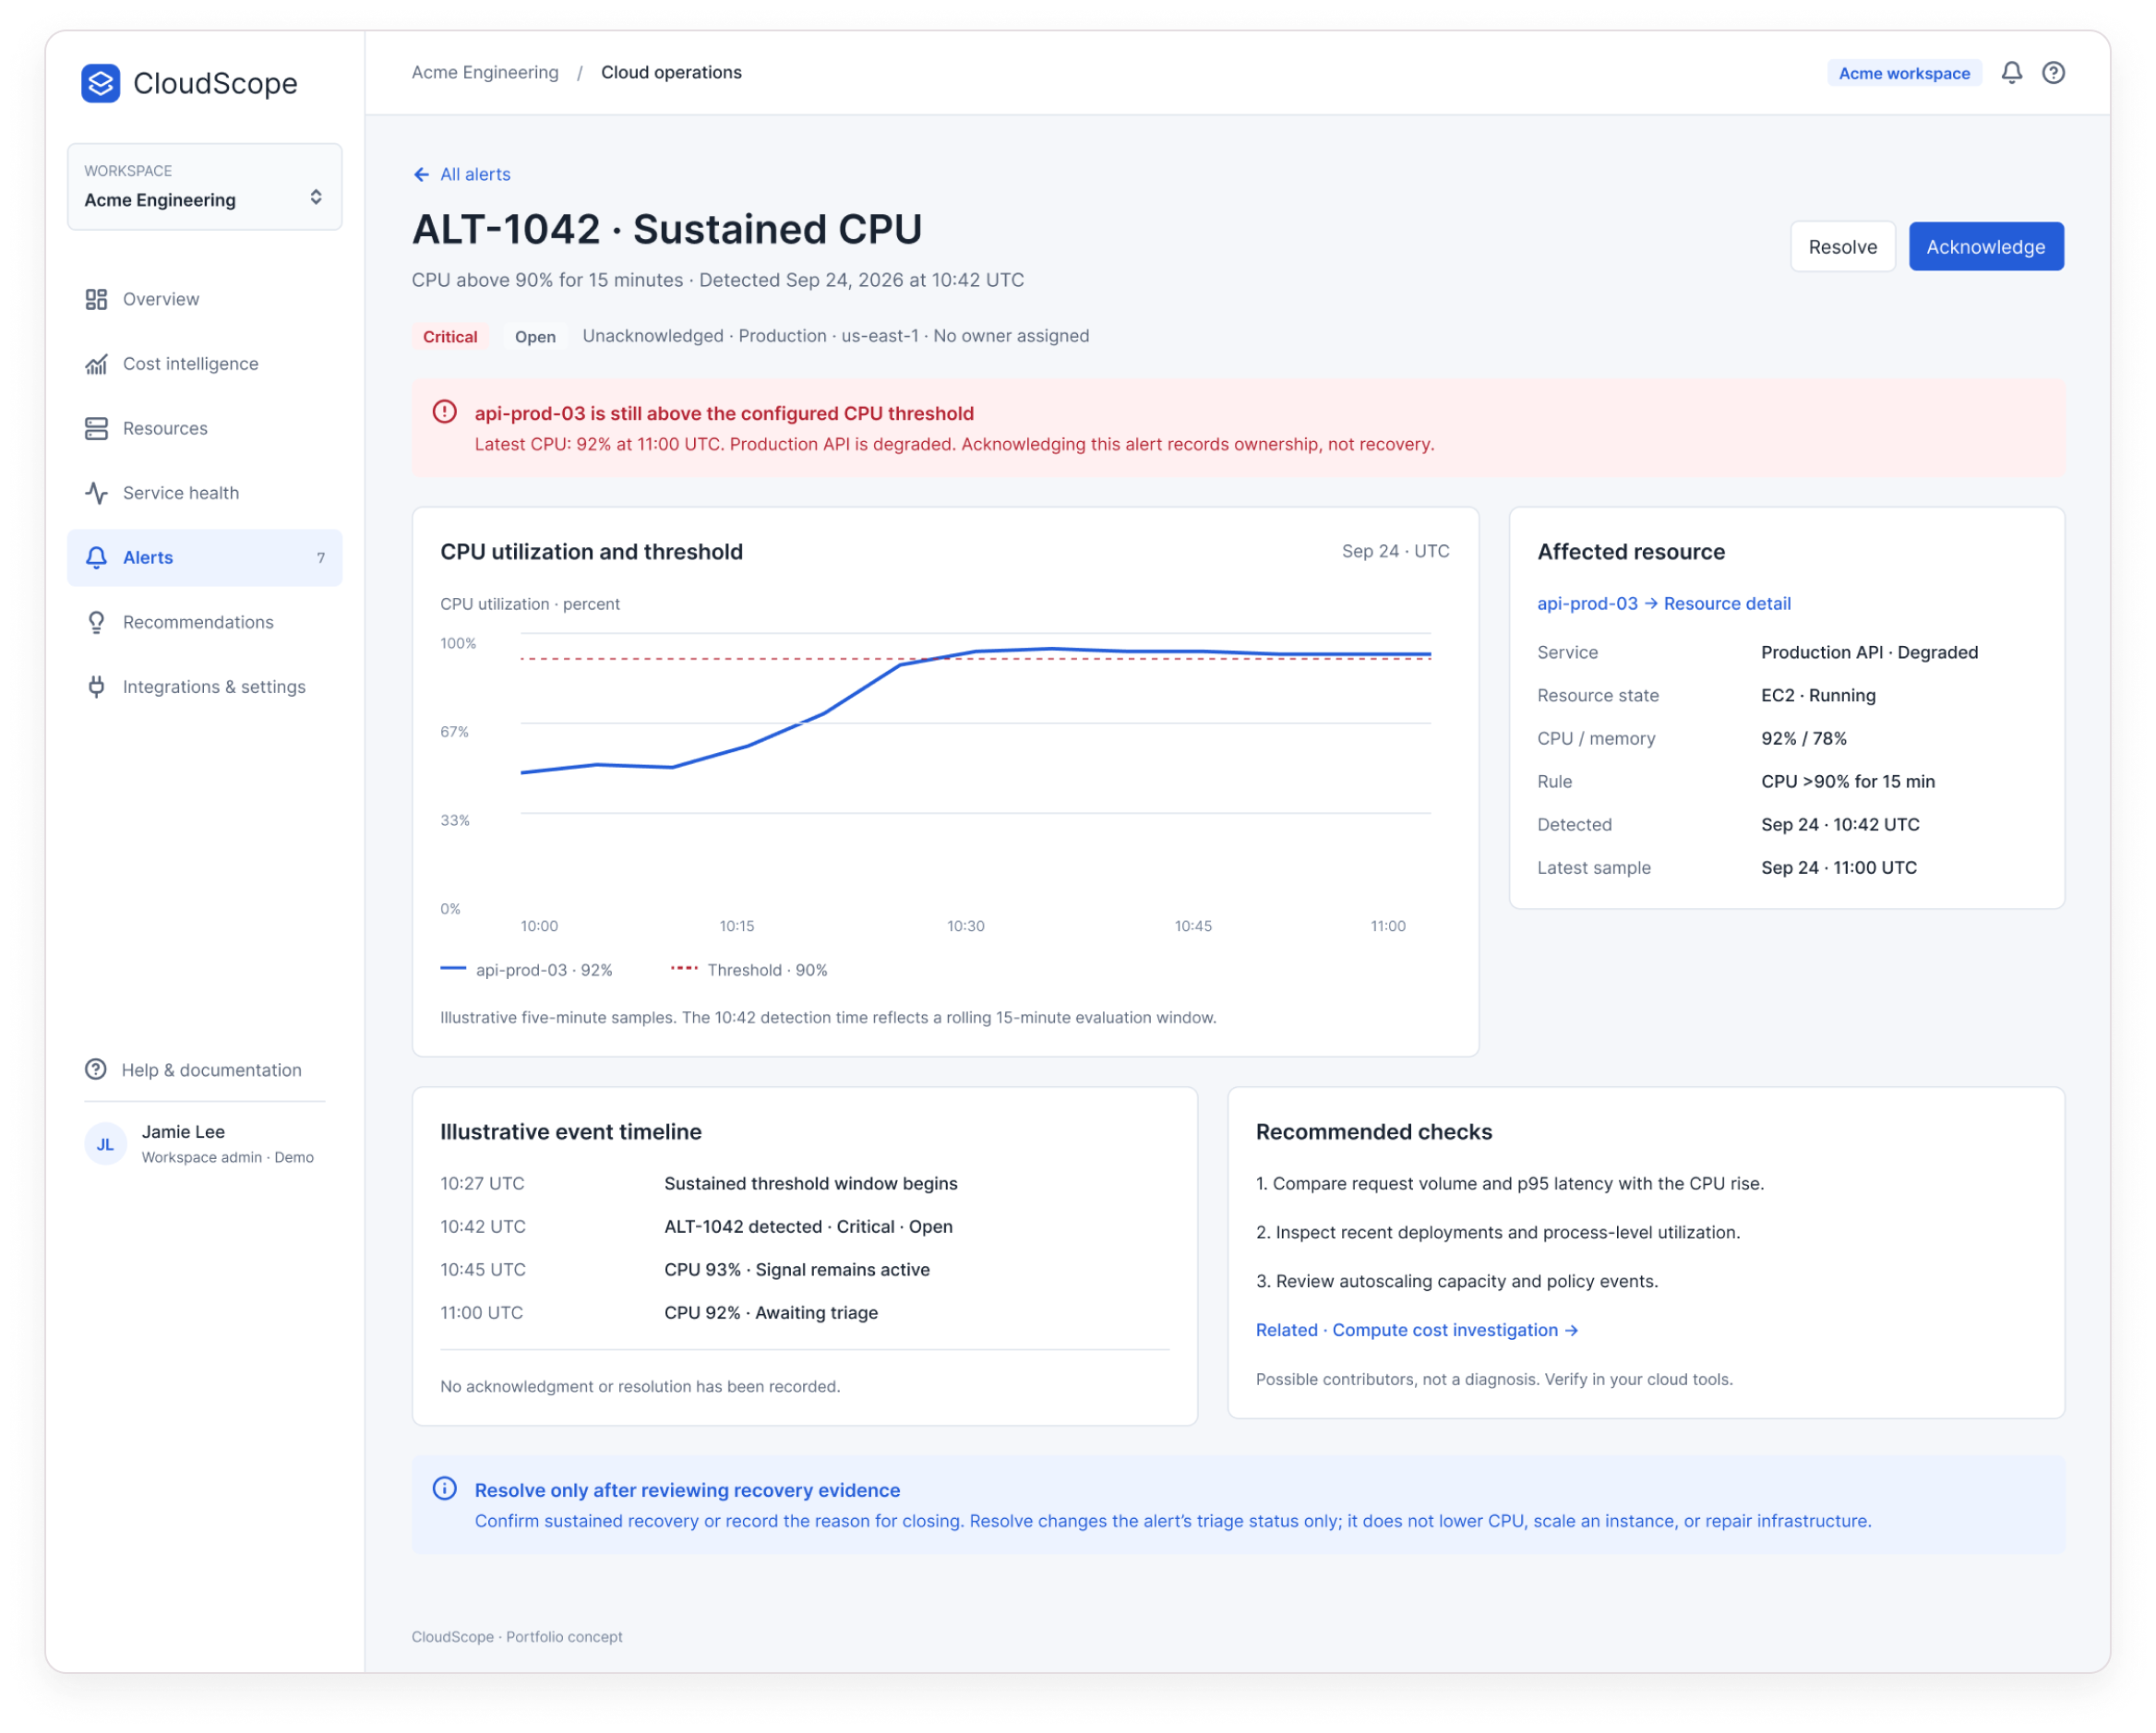
api-prod-03 at 92% CPU against a 90% threshold, its share of period cost ($1,180, already inside the compute total), and alert ALT-1042 with a timeline and three recommended checks.
Design decision
High CPU is framed as a reliability signal, not proof of the cost cause. “Acknowledge records ownership, not recovery”; Resolve changes triage status only.
Leads to
Back to the compute investigation, or on to recommendations.
CloudScope resource detail for api-prod-03
CloudScope alert detail for ALT-1042

Step 05

Review potential next steps

The question
Is there something worth changing , and what would it really save?
What’s visible
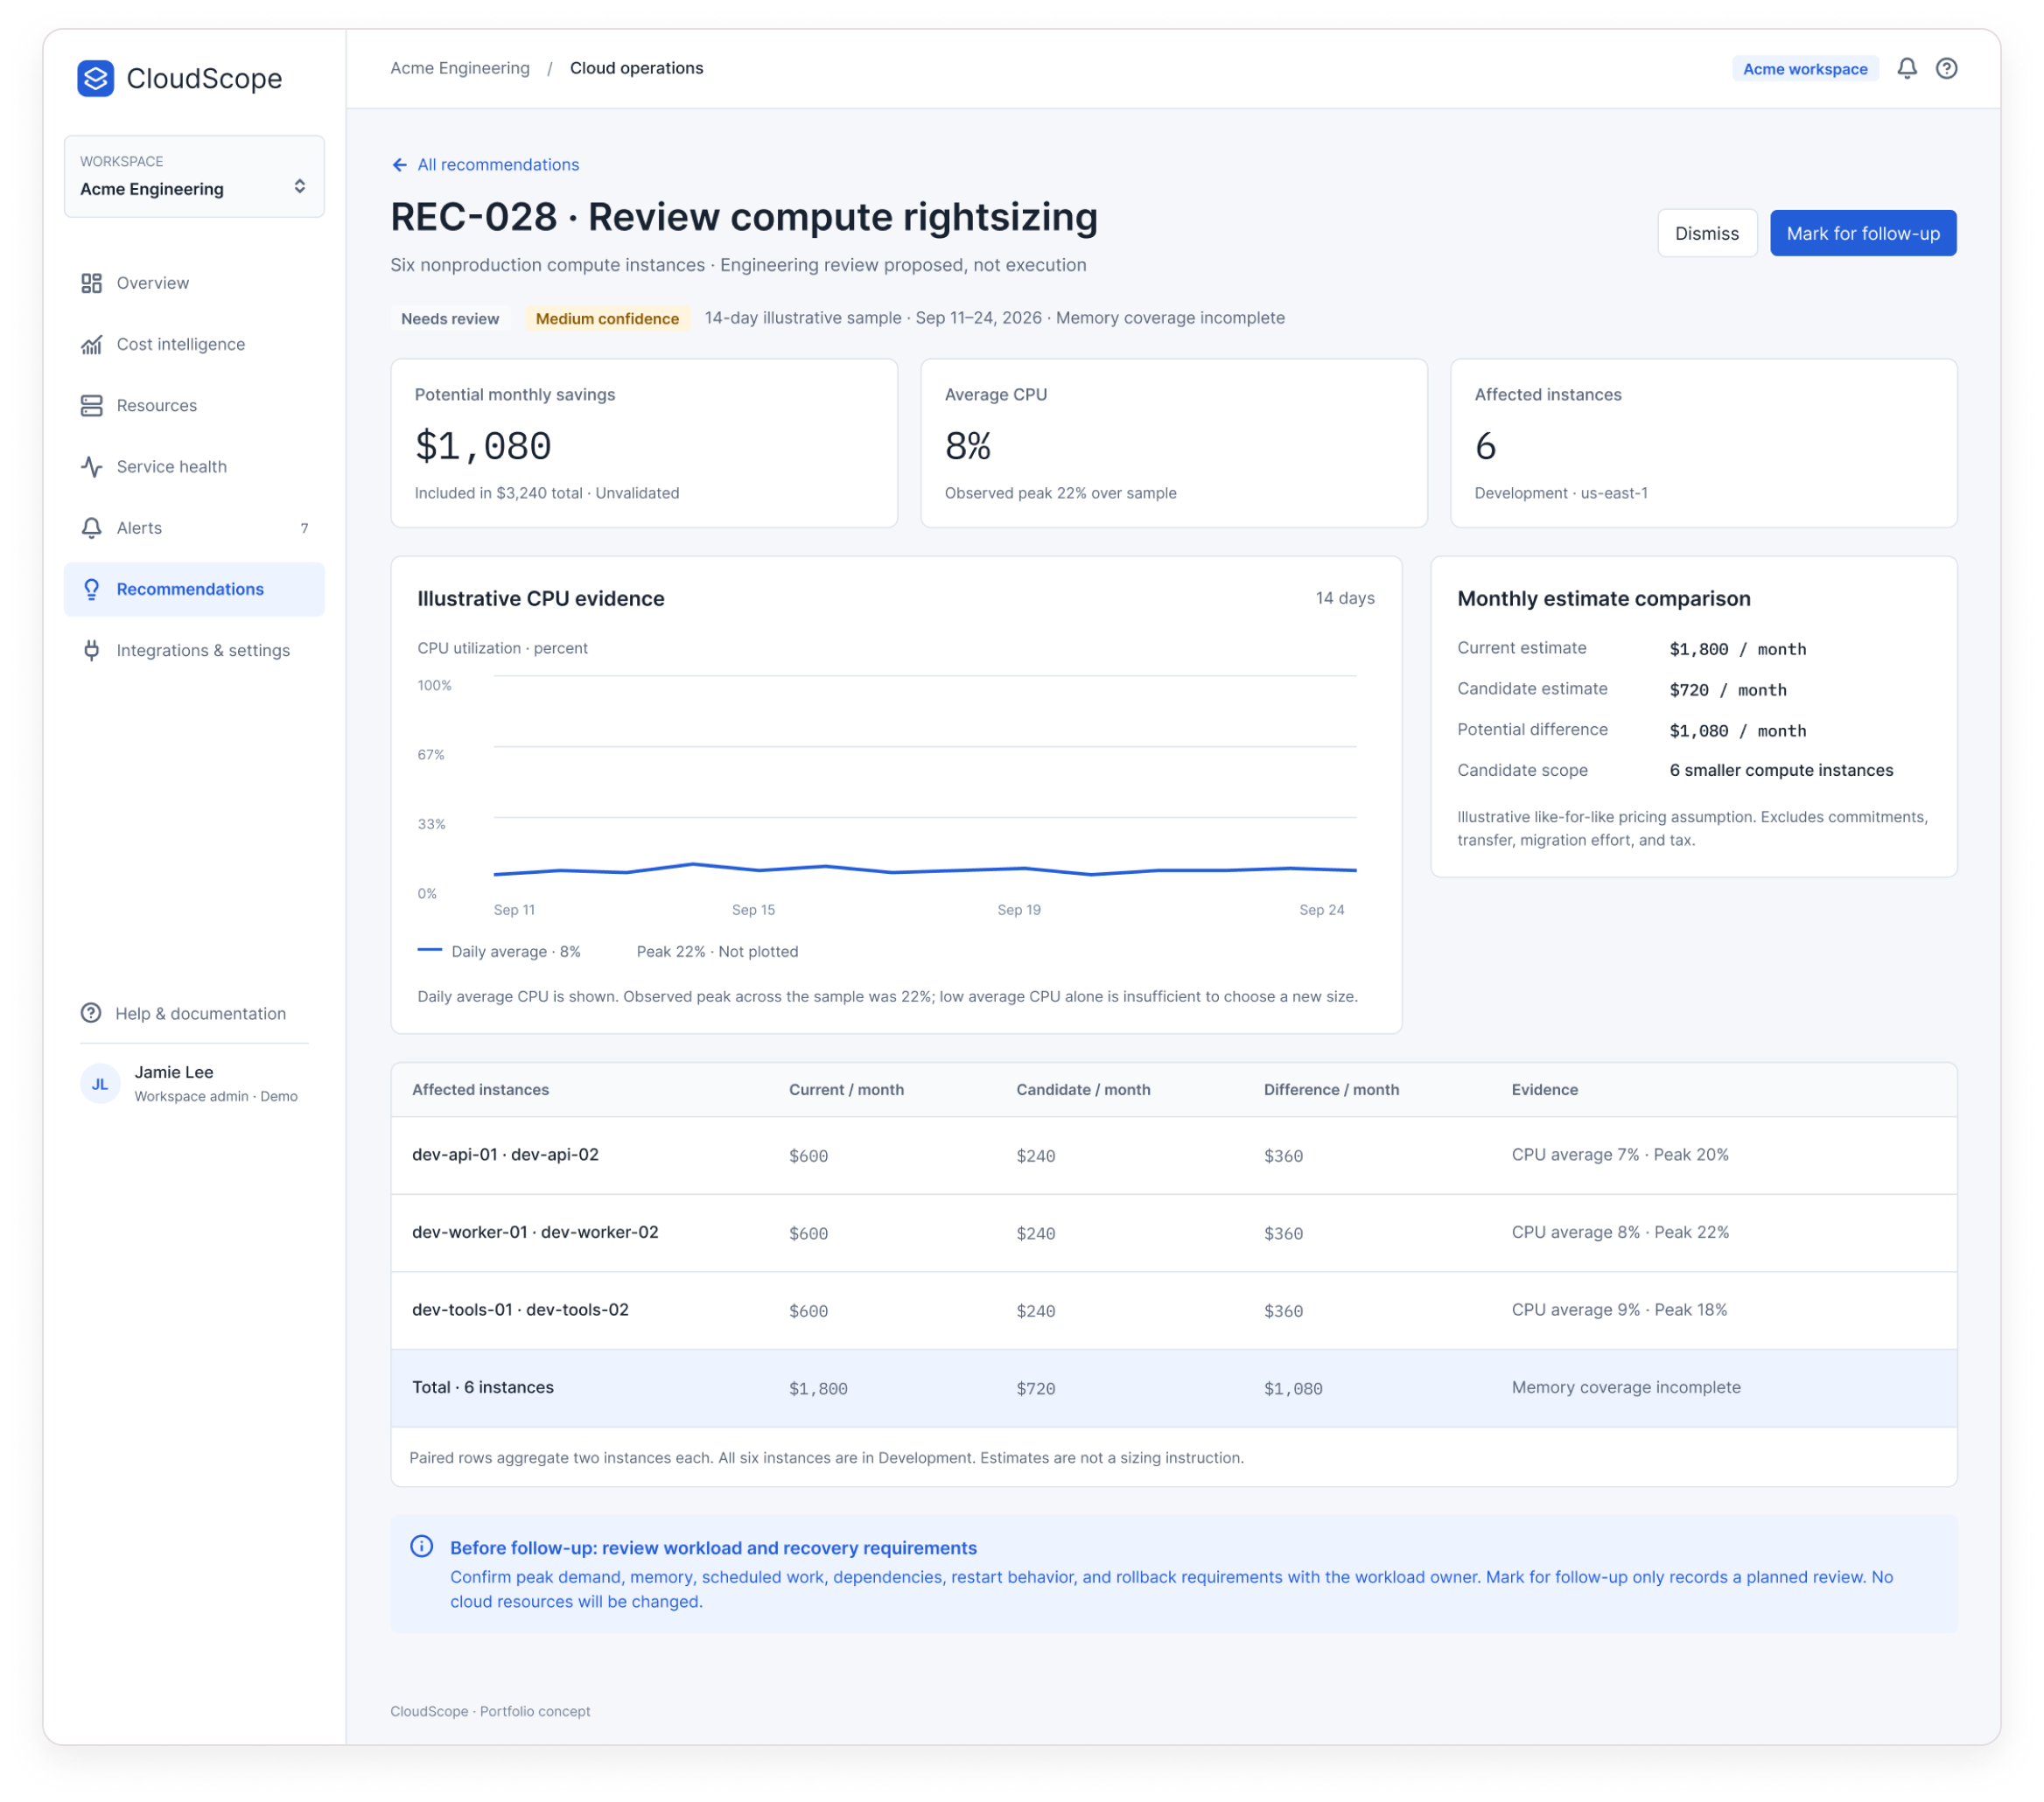
REC-028: six underused development instances, $1,080/month potential, medium confidence, incomplete memory coverage, and a current-vs-candidate cost comparison.
Design decision
Every caveat sits next to the number it qualifies. “Mark for follow-up” only records a planned review , no cloud resources change.
Leads to
A recorded follow-up, owned by people, outside the tool.
CloudScope recommendation detail REC-028

Beyond the investigation

The investigation borrows from the rest of the workspace. These screens establish the breadth of the concept.

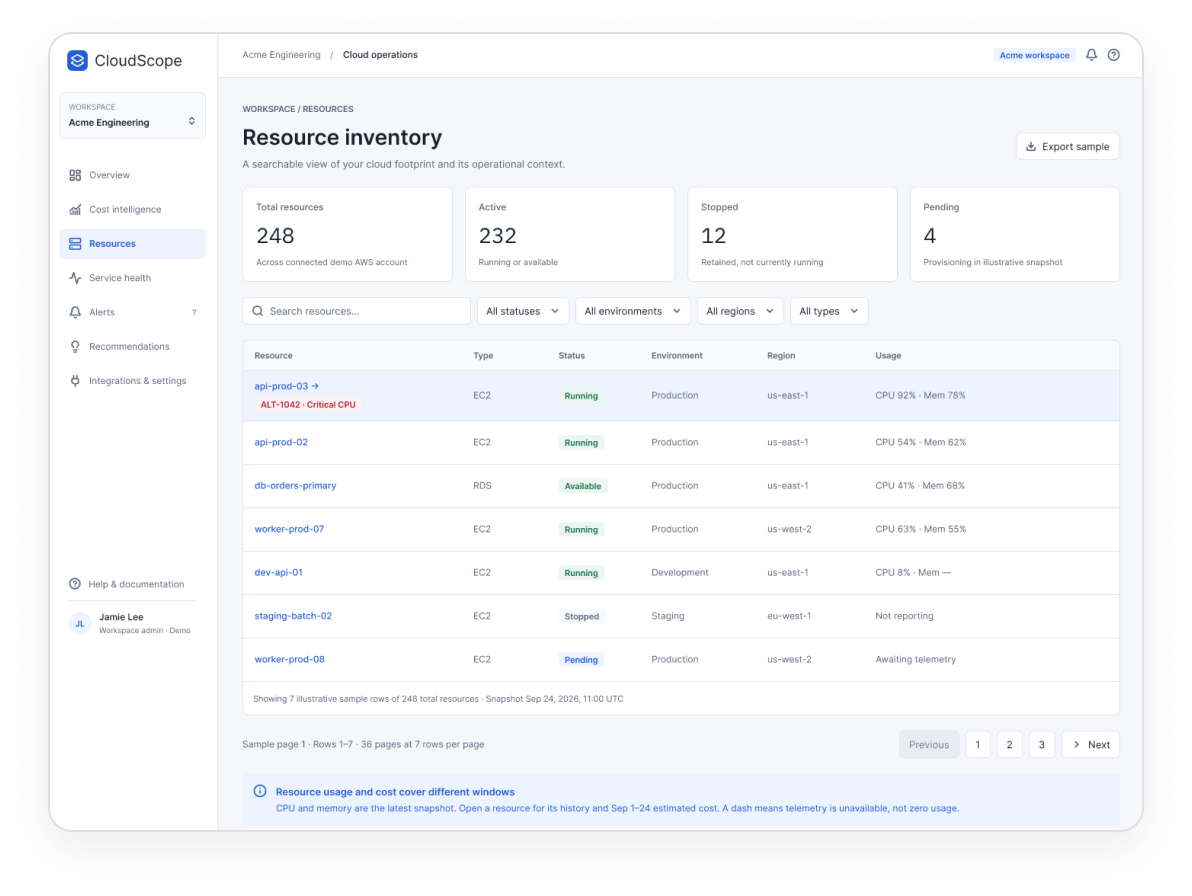
Resource inventory screen

Resource inventory

248 resources, searchable and filterable, with live-looking usage beside each one.

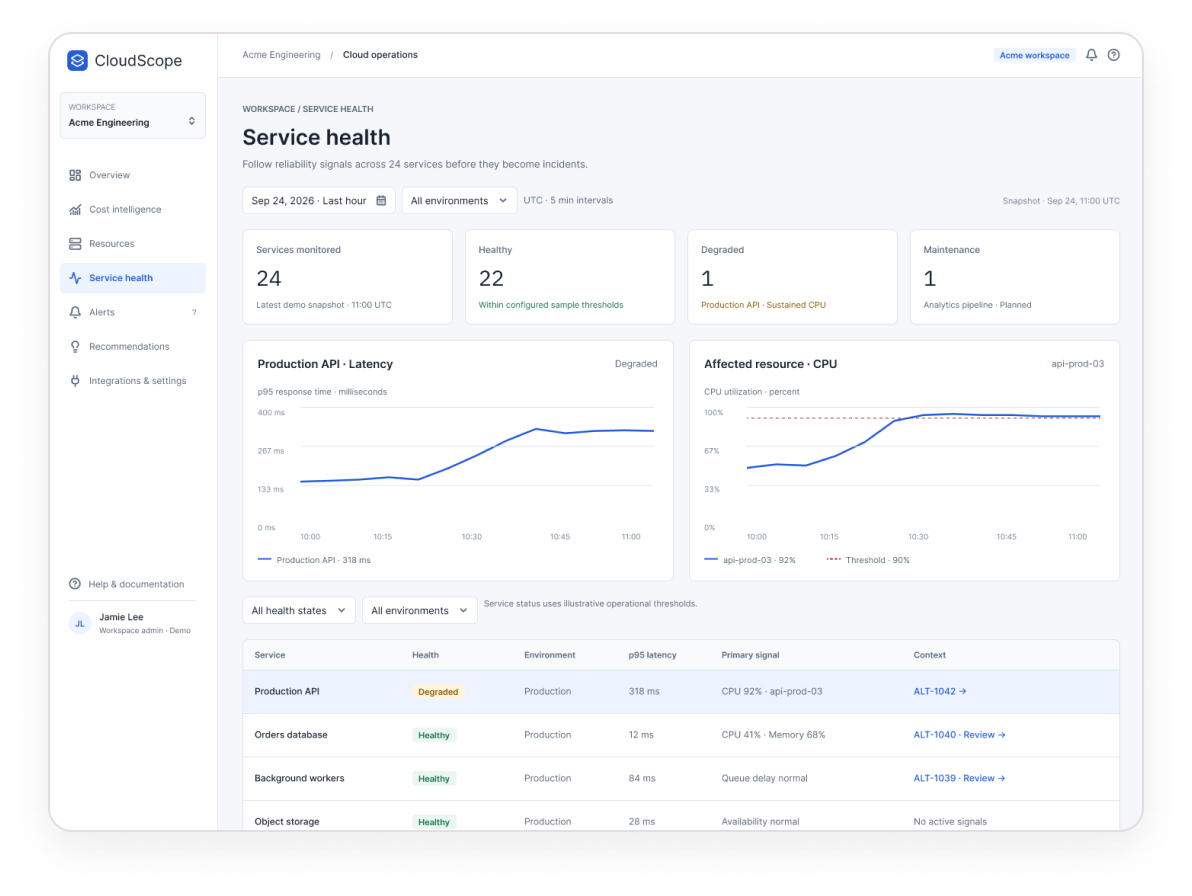
Service health screen

Service health

Status and history per service , “degraded” and “maintenance” said in words, not just colour.

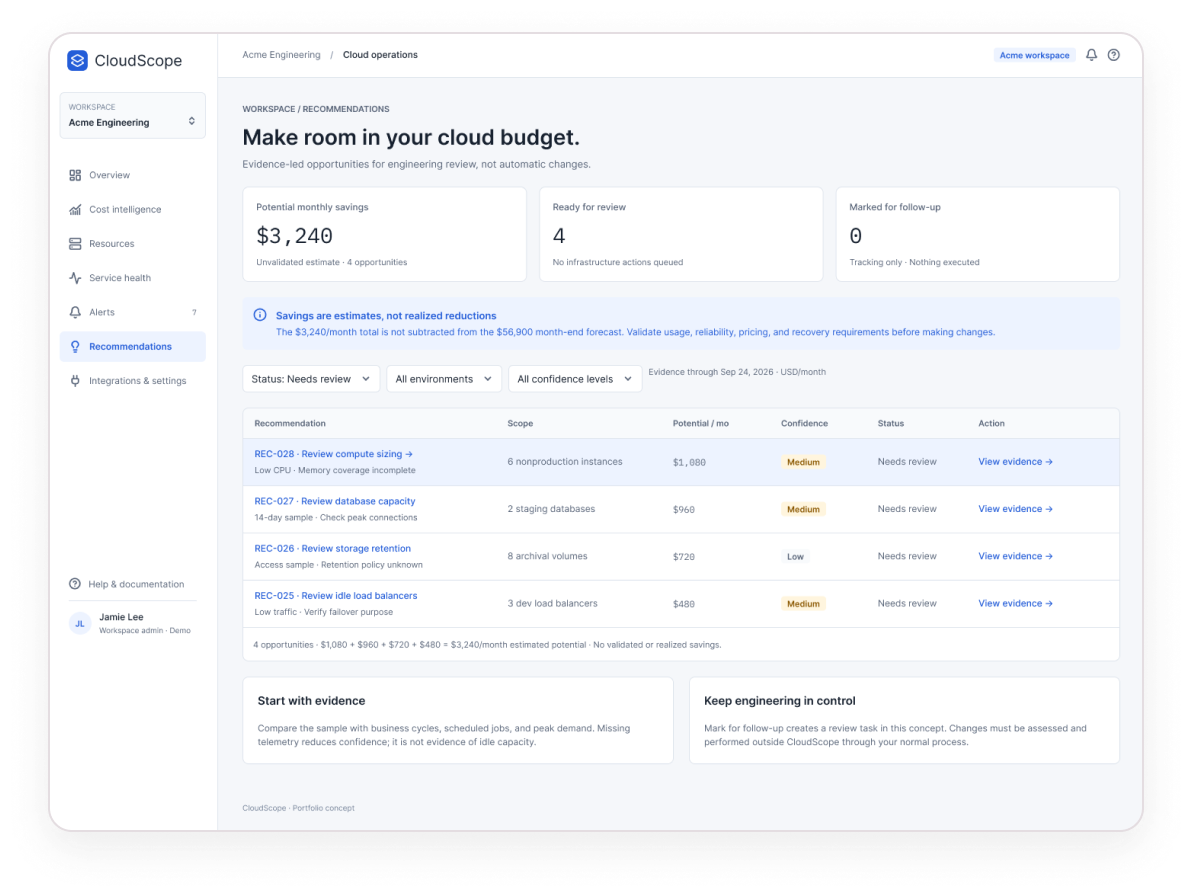
Recommendations screen

Recommendations

Four evidence-led opportunities “for engineering review, not automatic changes”.

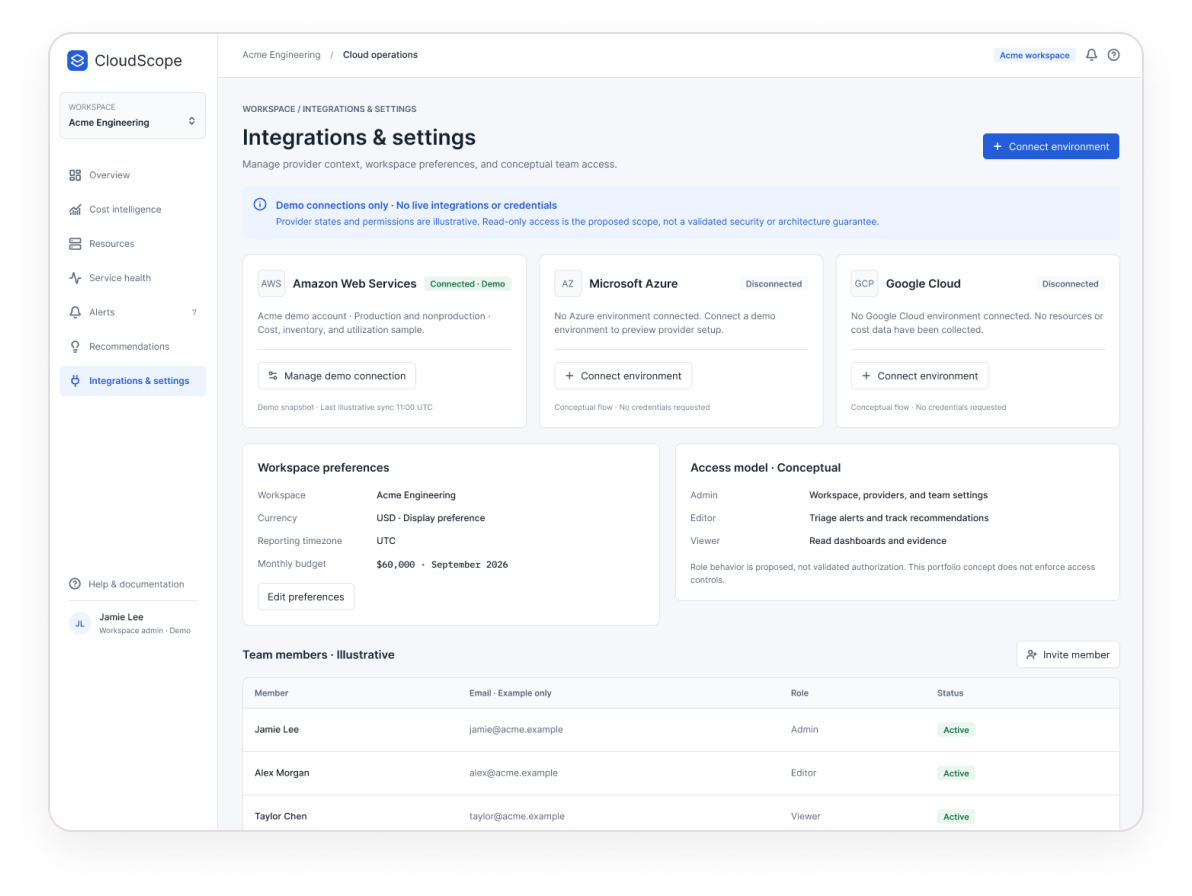
Integrations and settings screen

Integrations and settings

Where providers connect , framed as a read-only setup concept.

Imperfect conditions

No data doesn’t mean zero spend.

Cloud tooling is rarely fully connected. These states say what’s unavailable, what can still be trusted, and what to do next , instead of showing an empty chart that looks like good news.

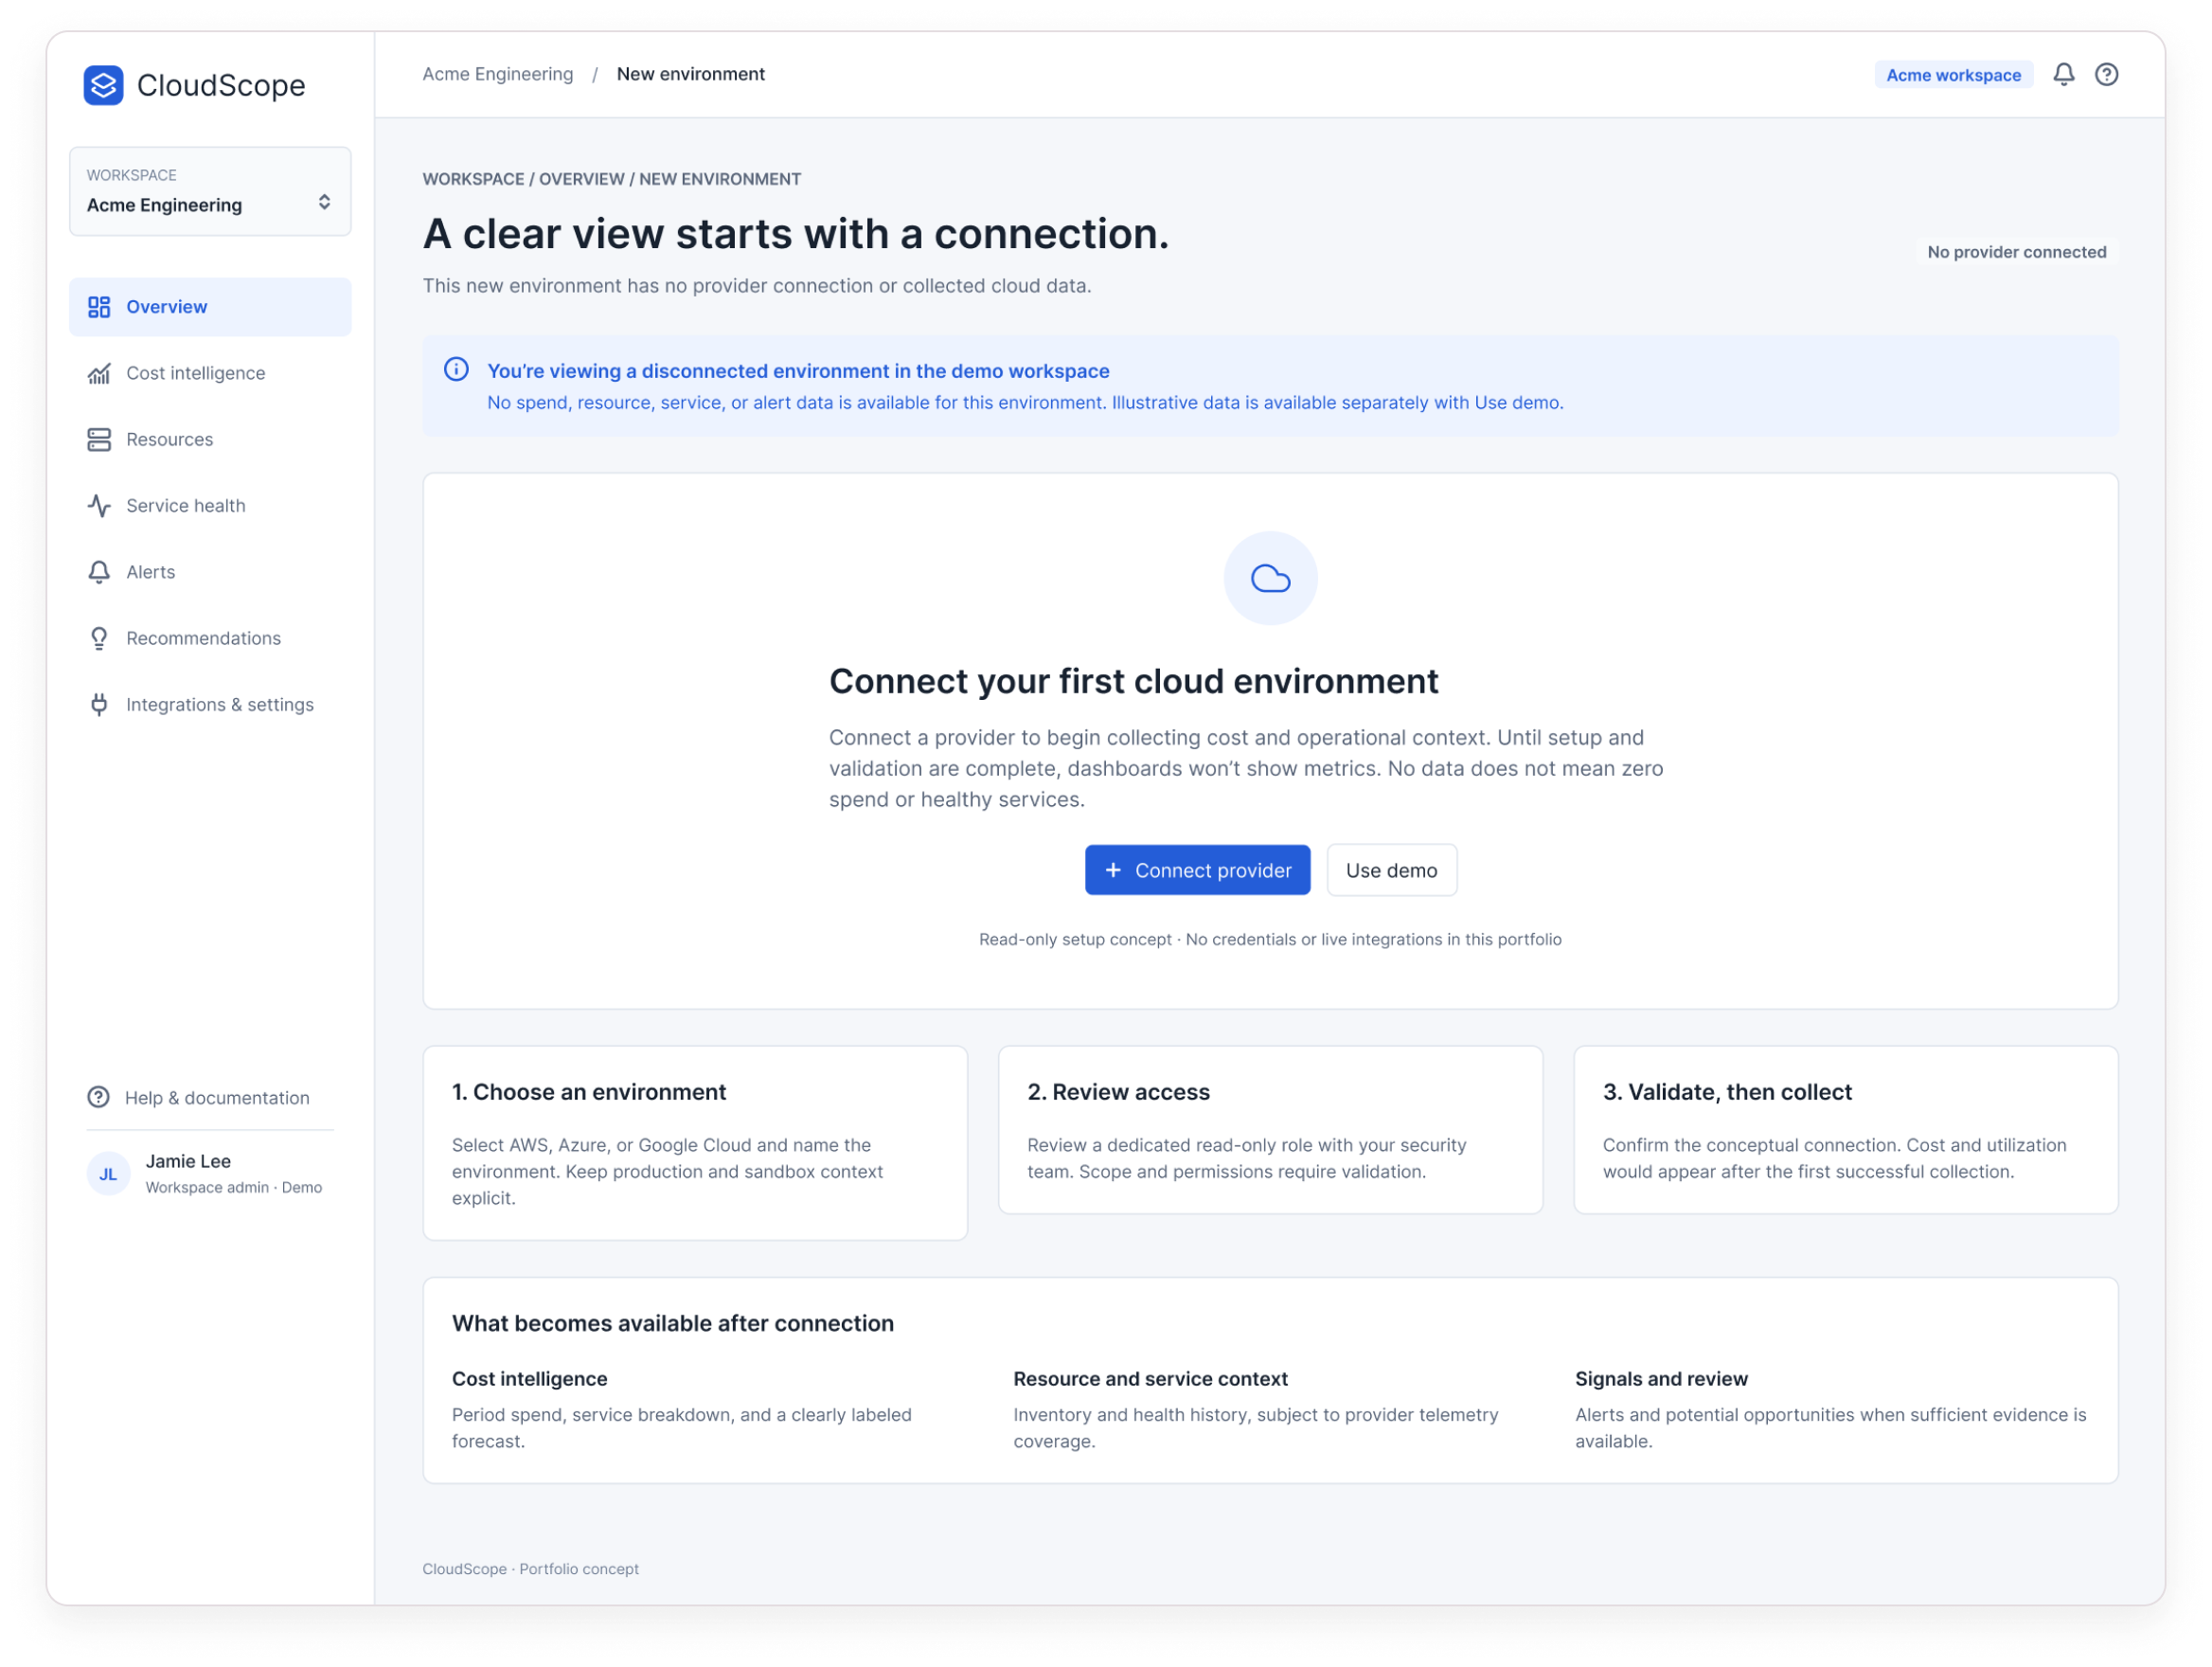
CloudScope disconnected environment
Disconnected environment: “Until setup and validation are complete, dashboards won’t show metrics. No data does not mean zero spend or healthy services.”
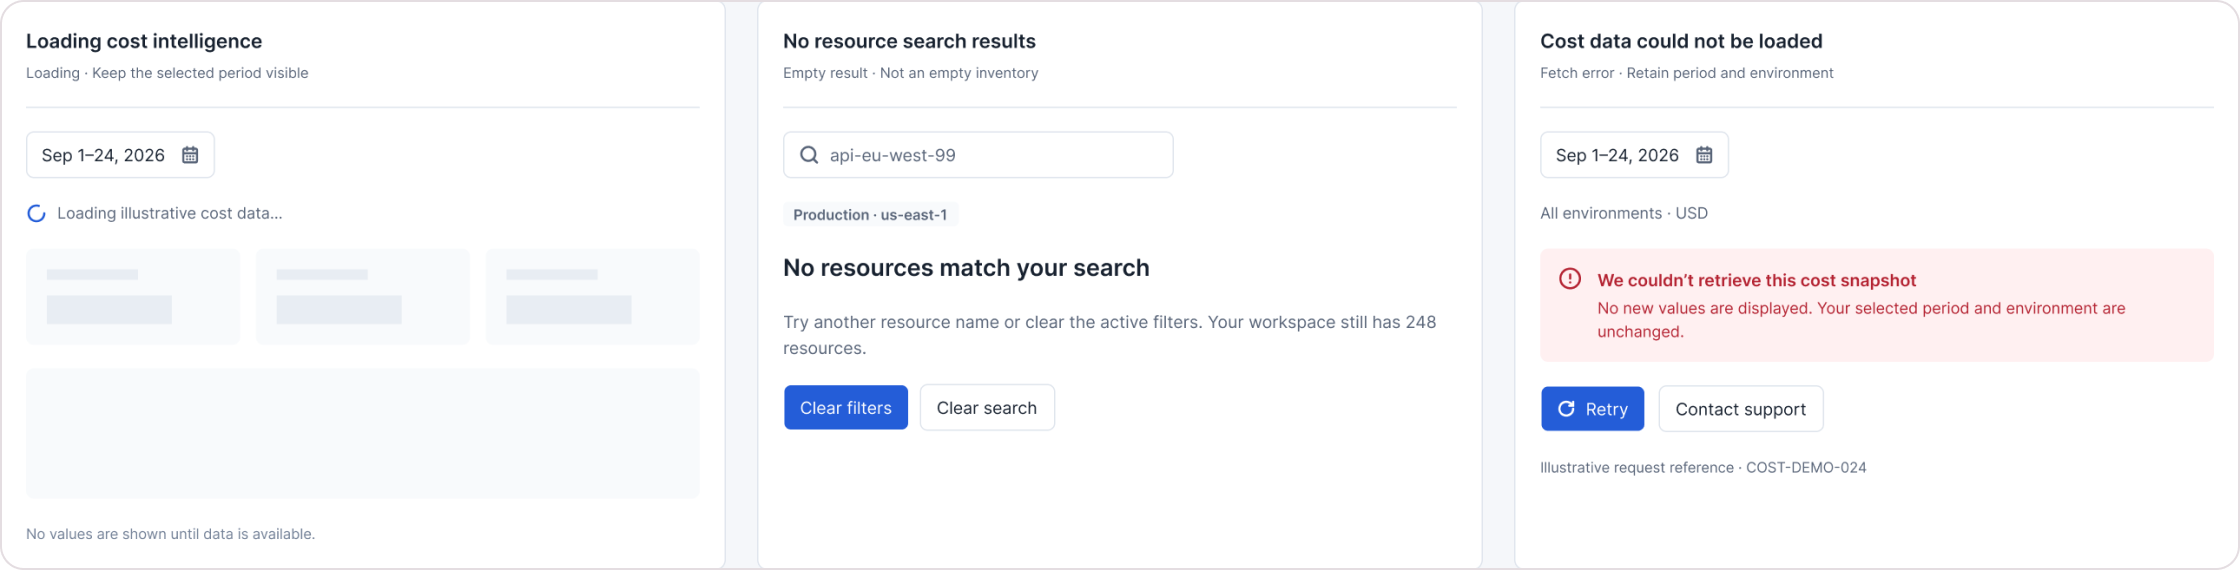
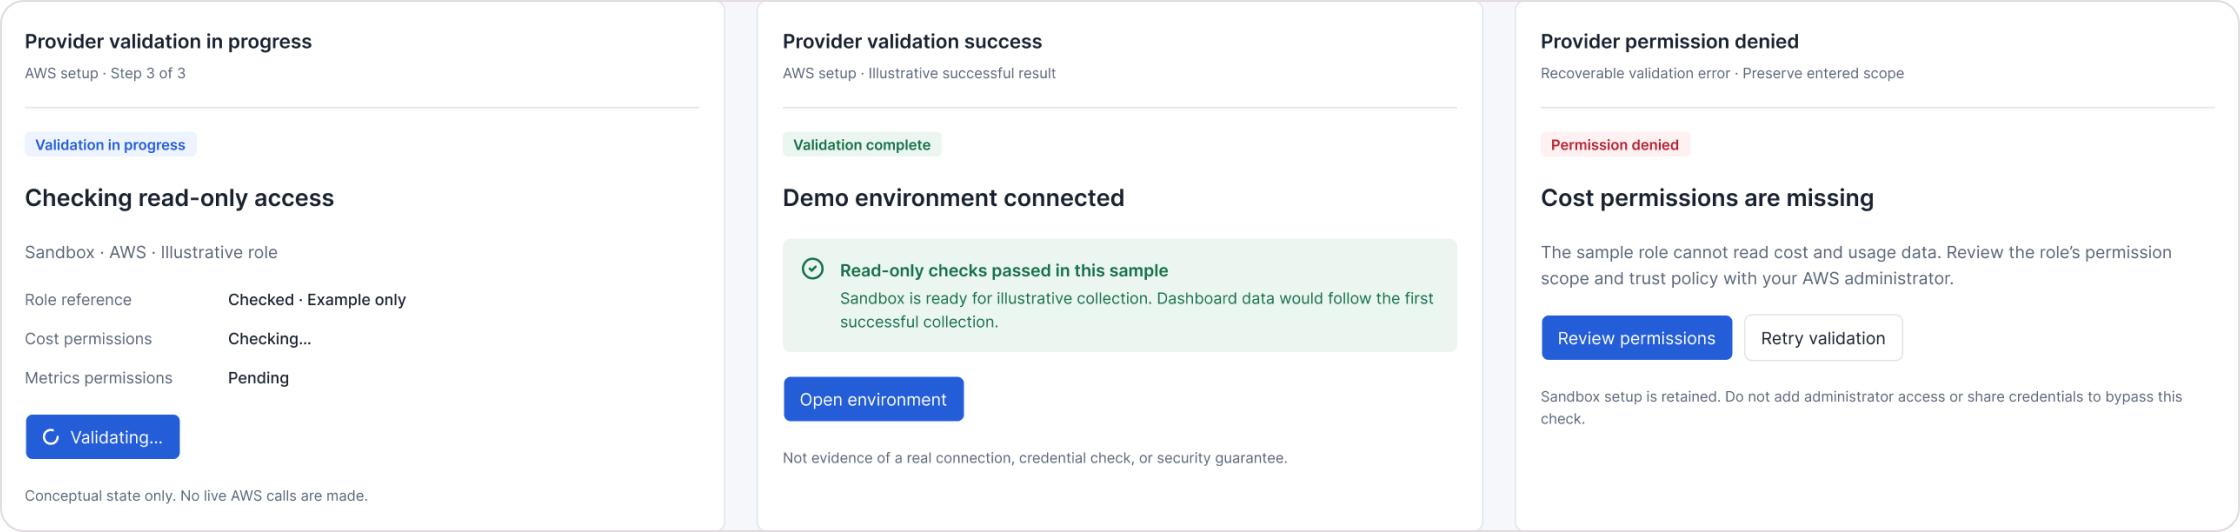
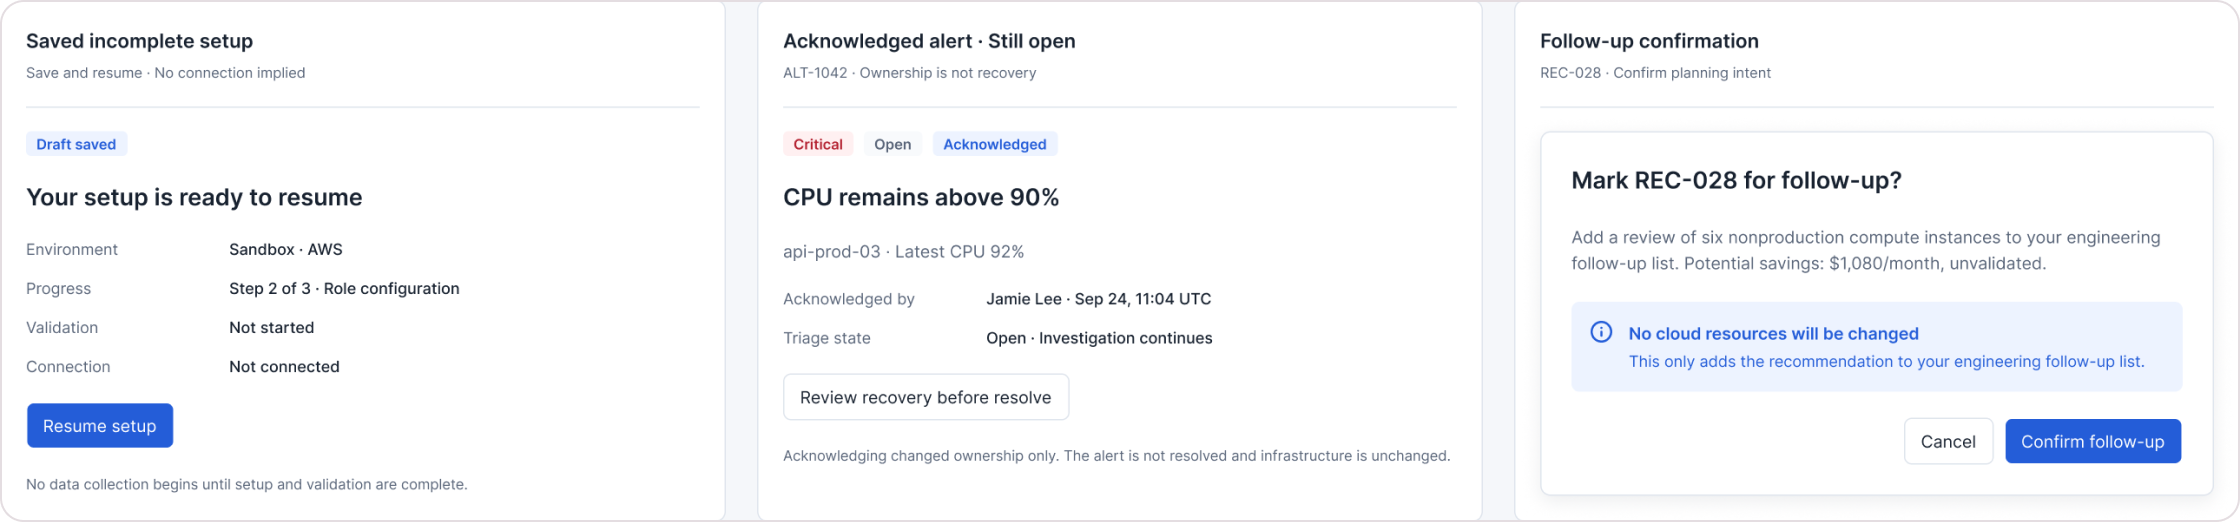
States: loading cost intelligence, no resource search results, cost data could not be loadedStates: provider validation in progress, success and permission deniedStates: saved incomplete setup, acknowledged alert still open, follow-up confirmation
From the states board: loading, empty search and a failed fetch with retry; provider validation from in-progress to permission denied; and triage states where an acknowledged alert stays open and a follow-up is confirmed without changing any infrastructure.
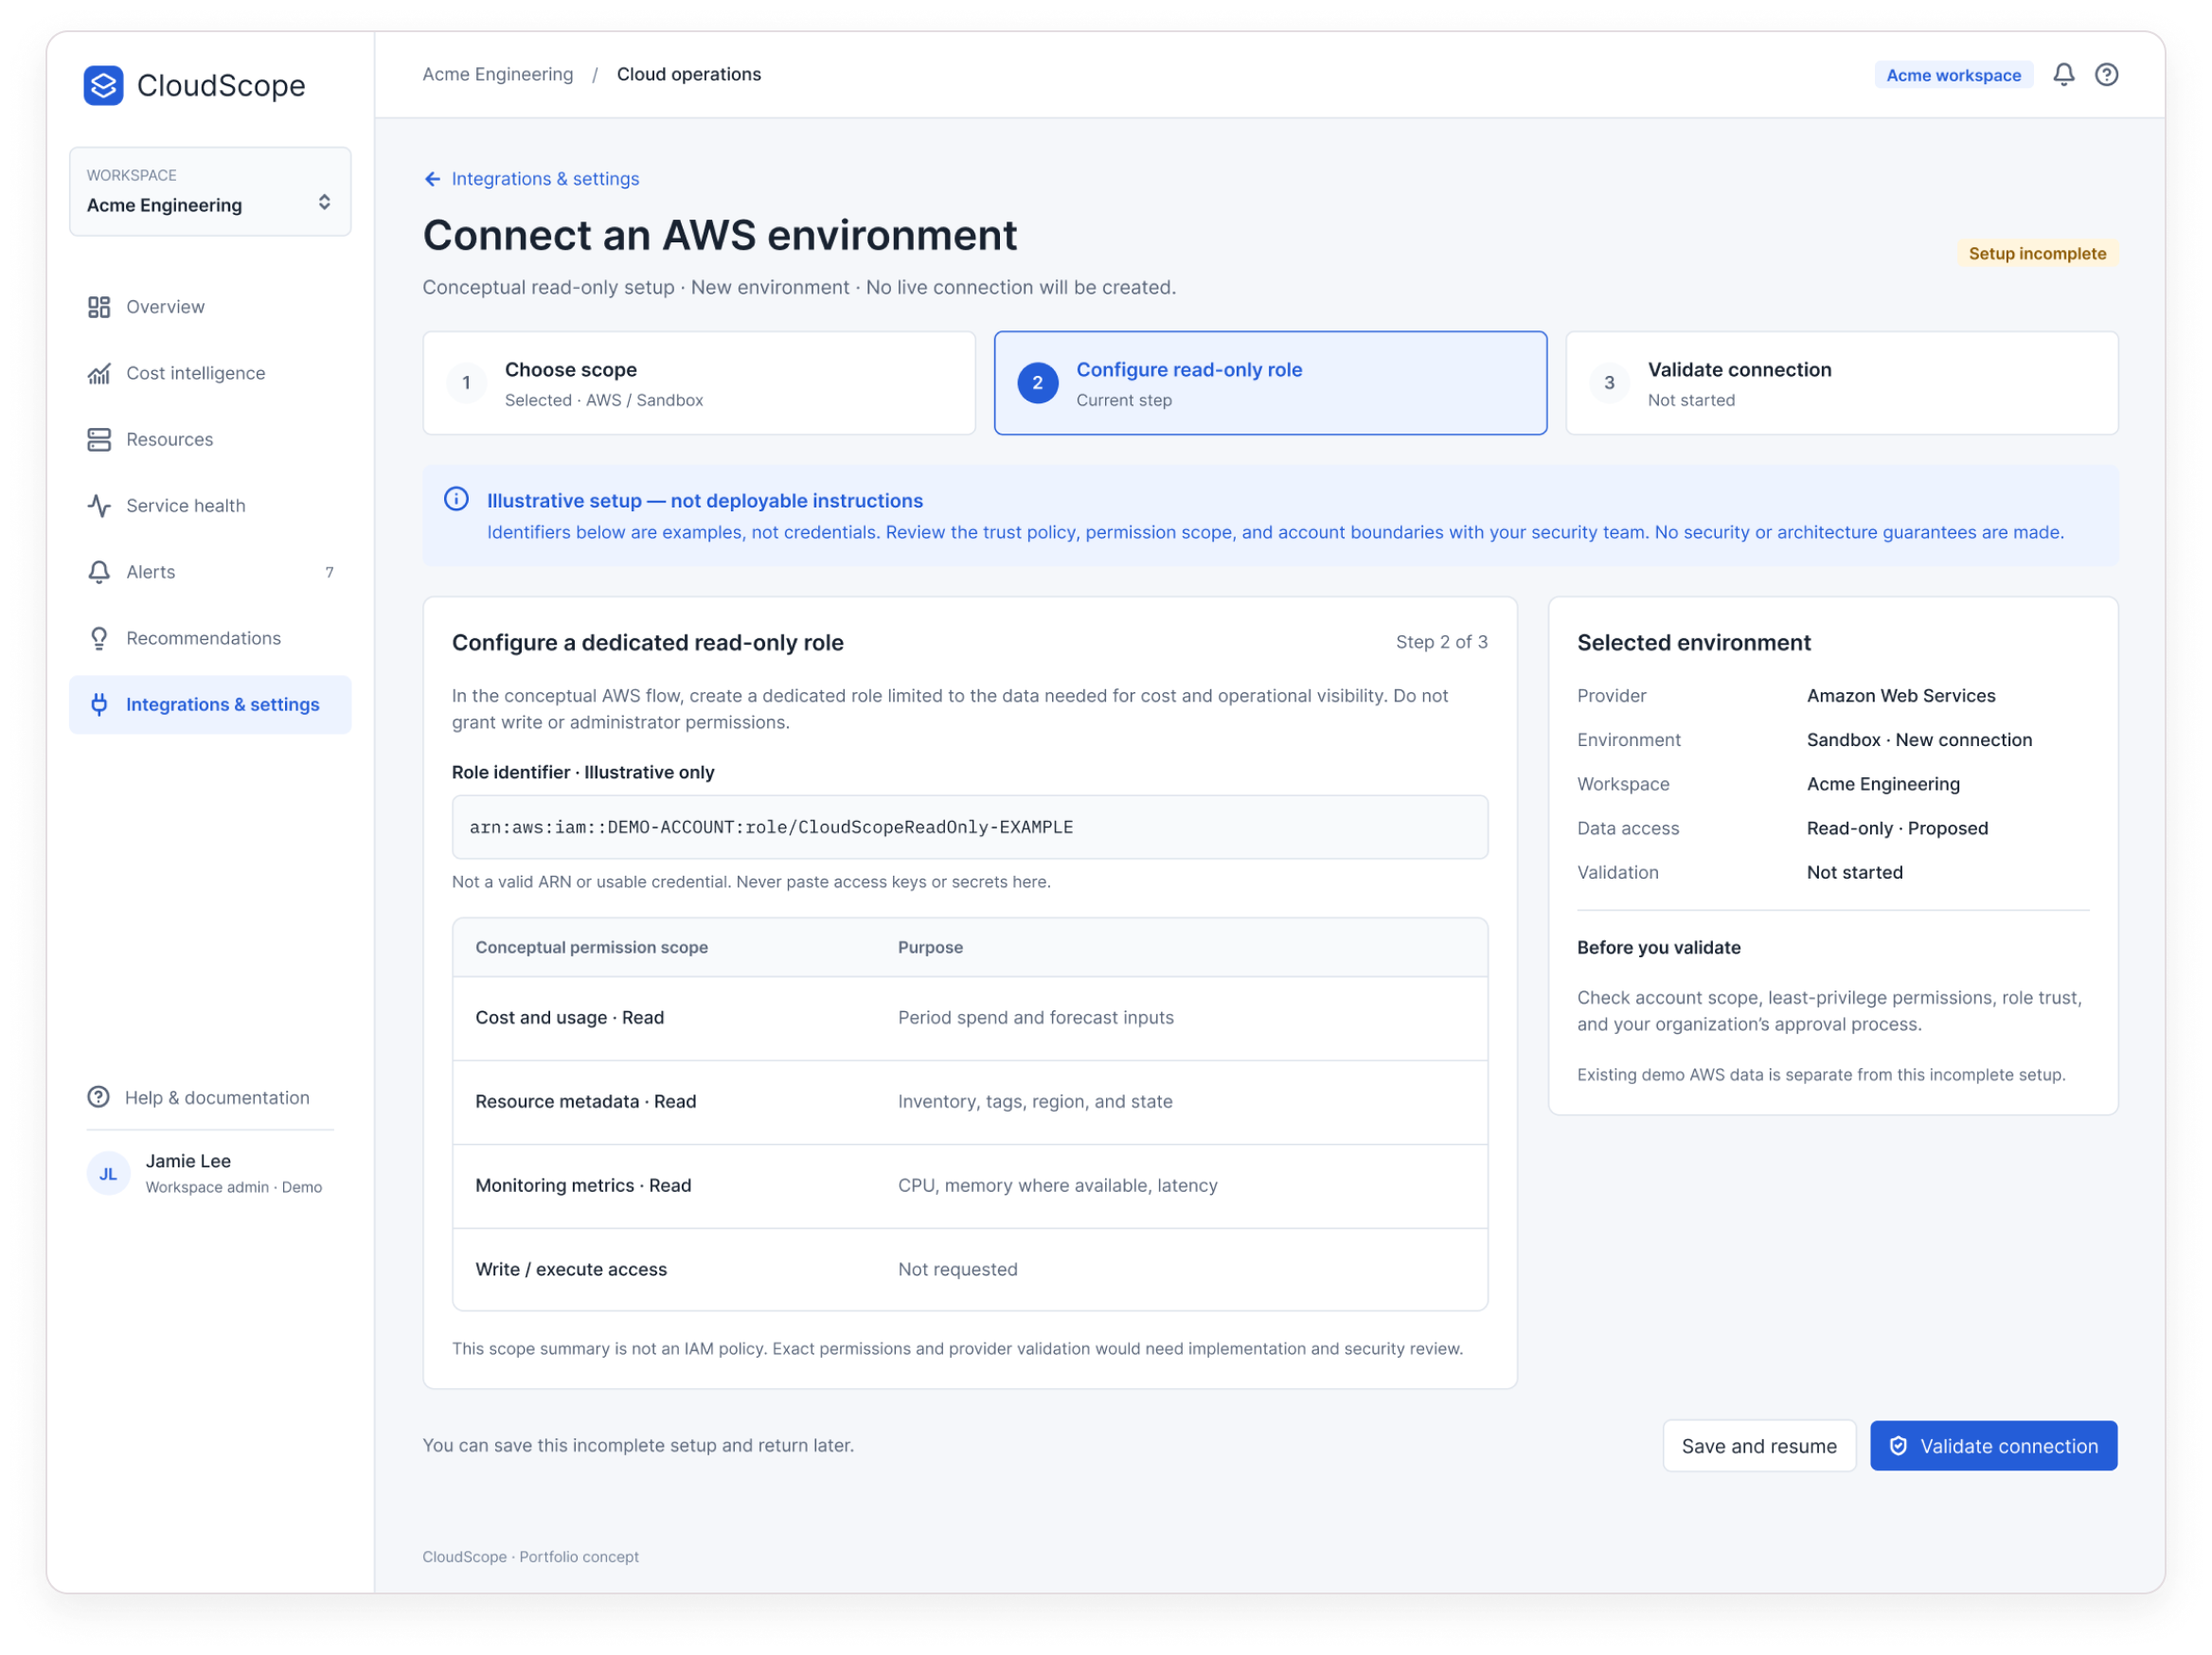
CloudScope conceptual AWS connection setup
A conceptual, read-only AWS setup: least-privilege intent, “Write / execute access · Not requested”, an incomplete state you can save, and no real credentials anywhere.

Visual system

Detail: CloudScope metric cards

Compact, light surfaces

Dense information needs calm backgrounds. A measured blue identity keeps colour free for meaning.

Status is never colour alone

Every status colour comes with a semantic label: Critical, Degraded, Needs review, Unvalidated.

Charts that explain themselves

Cumulative charts carry units, dates and comparison periods; estimates are dashed and visually distinct.

Tokens and components

40 colour and 33 dimension variables, 29 text styles, and shared navigation, metric cards, rows, badges, banners and dialogs. A first-pass library , not a production-complete system.

Reflection

Honest dashboards are harder to design.

The hardest part wasn’t the charts , it was the language around them. Deciding what a screen is allowed to claim, and saying so plainly, shaped almost every component: badges, captions, banners and button labels.

What remains unvalidated: the concept hasn’t been tested with users; the prototype is a static walkthrough; search, filters and setup are visual concepts; it’s desktop light mode only; and forecast method, provider permissions and recommendation logic would need engineering and security review.

Questions for future evaluation

  • Can intended users spot an important spending change quickly?
  • Can they tell a measured value from a forecast or estimate?
  • Do they understand why an alert matters and where to investigate?
  • Do recommendation details give enough context to support a decision?
  • Are disconnected and error states clear enough to guide recovery?

Have a product problem worth solving?

Let’s talk